NumXL Pro
Whether you have a simple homework problem or a large-scale business project, NumXL simplifies your efforts. It helps you reach your goal in the quickest, most thorough way possible.
NumXL also keeps your data and results connected in Excel, allowing you to trace your calculations, add new data points, update an existing analysis, and share your results with ease.
NumXL allows you to hit the ground running, it does it not require any programming or scripting knowledge and is designed for ease of use: You will not have to move your data between any external programs. You can also perform any ad-hoc analysis, as all of the NumXL functions are accessible in your spreadsheet, and inside the VBA environment, should you choose to write a macro(s).
What can NumXL do for me?
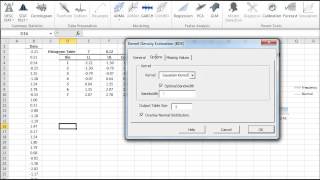
Summary Statistics
Descriptive statistics is the discipline of quantitatively describing the main features of a collection of data; The main aim is to summarize a data set, rather than use the data to learn about the population that the data are thought to represent.
Some measures that are commonly used to describe a data set:
- Location / central tendency: mean, median, mode, etc.
- Variability or statistical dispersion
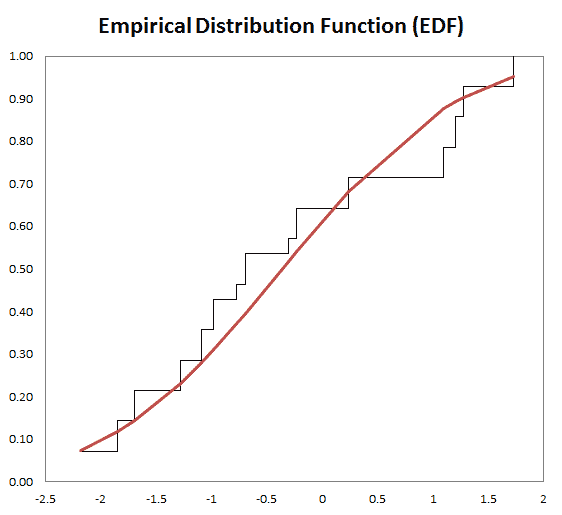
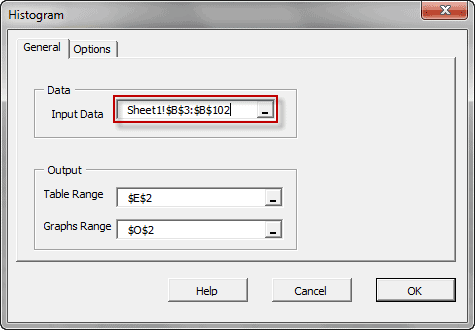
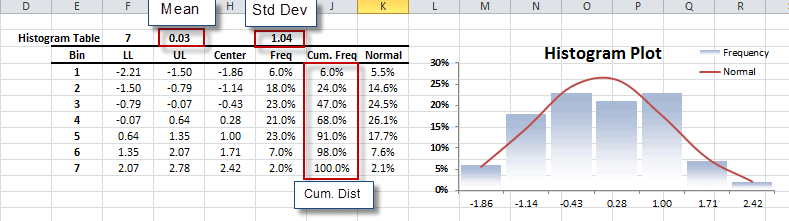
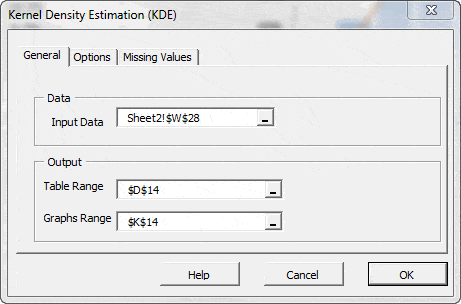
- The Shape of the distribution, either via indices such as skewness, kurtosis, quantile, or via tabular and/or graphical format, such as Histogram, EDF, and Kernel density estimate (KDE).
- Statistical dependence: serial/autocorrelation and cross-correlation.
Examples: mean, median, mode, etc.
Featured Functions:
| Function | Description |
|---|---|
| EWMA | Exponential-weighted moving volatility |
| GINI | Gini Coefficient |
| Quantile | Sample Quantile |
| IQR | Inter-quartile Range |
| MD | Mean absolute difference |
| MAD | Median absolute difference |
| RMD | Relative mean difference |
| LRVar | long-run variance (Bartlett kernel) |
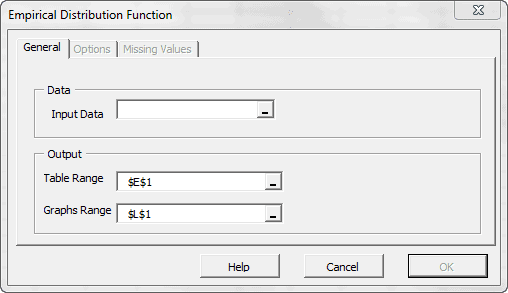
The variable Distribution is depicted via a tabular or a graphical representation.
Featured Functions:
| Function | Description |
|---|---|
| EDF | Empirical Distribution Function |
| KDE | Kernel Density Function |
| NxHistogram | Frequency distribution (Histogram) |
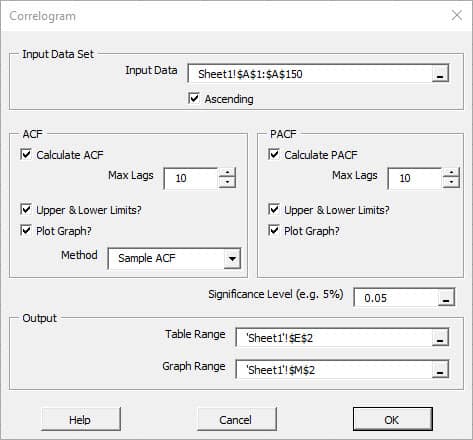
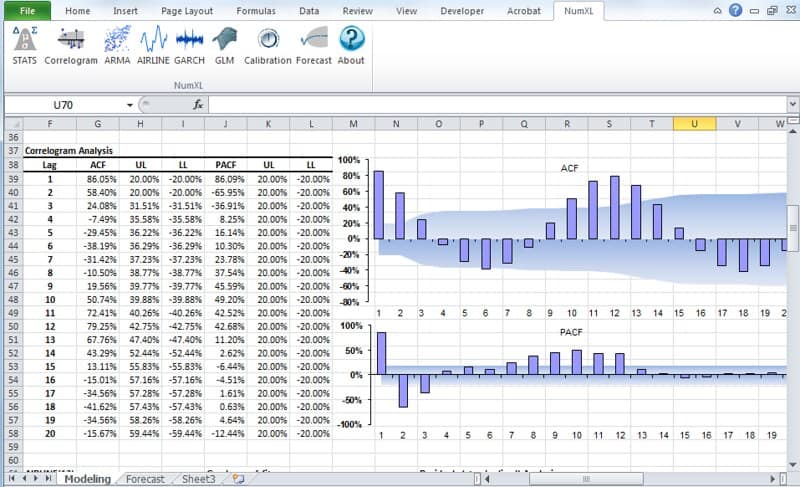
- For one data set, serial or auto-correlation functions (e.g. ACF, PACF) are commonly used tools for not only checking randomness, but also in model identification stage for ARMA-type of models.
Featured Functions
Function Description ACF Autocorrelation function PACF Partial autocorrelation function Hurst Hurst Exponent - For two or more variables, cross-correlations are used to measure how those variables are related to one another.
Featured Functions
Function Description XCF Cross-correlation function EWXCF Exponentially-weighted cross correlation
See Also
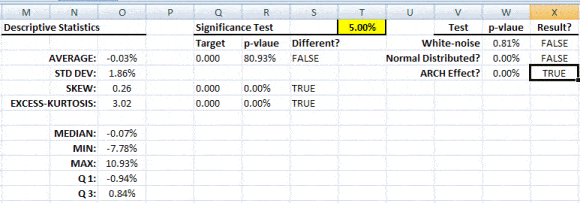
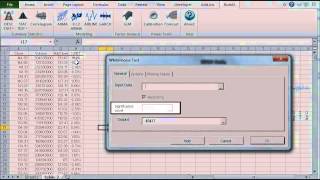
Statistical/Hypothesis testing is a common method of drawing inferences about a population based on statistical evidence from a sample. For instance, statistical testing techniques are often applied for examining the significance (e.g. difference than zero) of a calculated parameter (e.g. mean, skew, kurtosis), or for verifying an assumption (e.g. Normality, white-noise, stationary, cointegration, multi-collinearity, etc.) using finite sample data.
In NumXL, the statistical testing functions can be broken into the following categories:
This category describes a suite of one-sample tests that compare the mean (or another location measure) of one sample to a known standard (known from theory or are calculated from the population).
Featured Functions:
| Function | Description |
|---|---|
| TEST_MEAN | One-sample population mean Test |
These are also a one-sample test that compares the variance (or another statistical dispersion measure) of one sample to a known standard (known from theory or are calculated from the population).
Featured Functions:
| Function | Description |
|---|---|
| TEST_STDEV | Standard Deviation Test |
| TEST_SKEW | Skewness Test |
| TEST_XKURT | Excess Kurtosis Test |
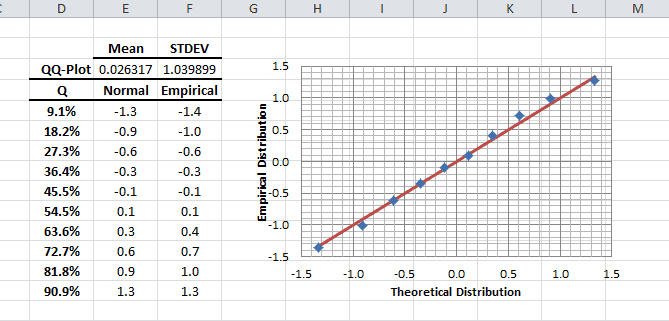
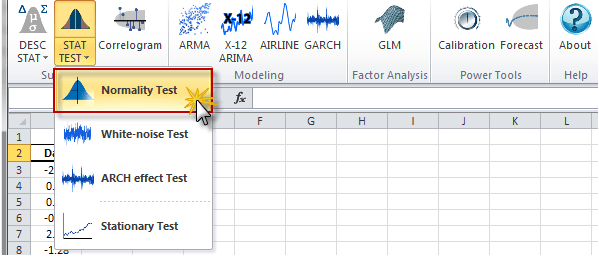
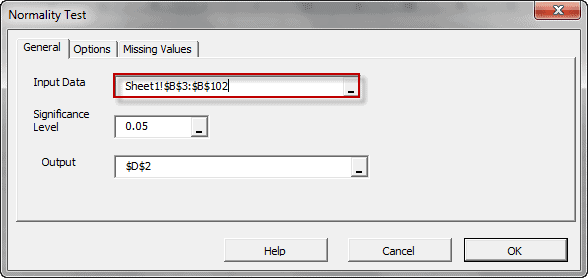
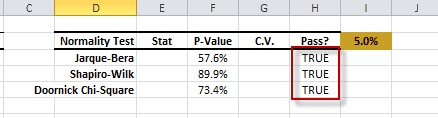
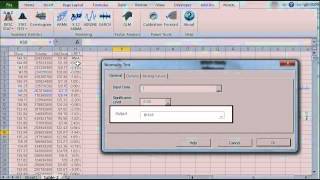
The statistical tests are one-sample tests that examine an assumption about the distribution of the random variable (e.g. Normality).
Featured Functions:
| Function | Description |
|---|---|
| NormalityTest | Testing for Normal/Gaussian Distribution |
In this category, we group the functionality based on the number of variables they apply to:
- One variable – Serial (aka. Auto) correlation
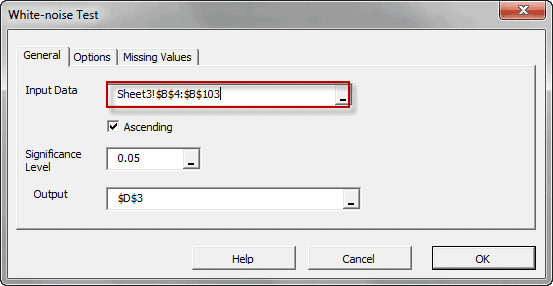
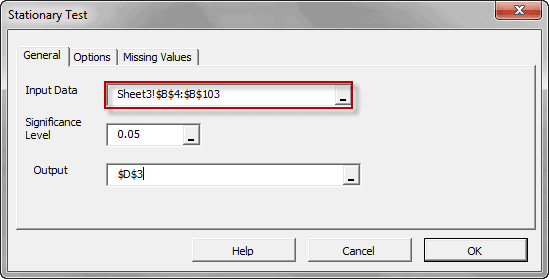
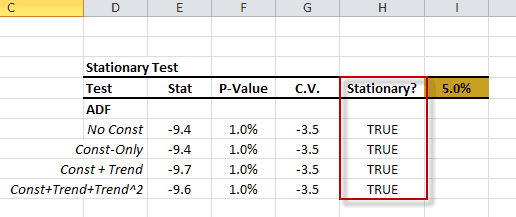
Featured Functions:Function Description ACFTest Autocorrelation Test WNTest White-Noise Test ARCHTest Test of ARCH Effect ADFTest Augmented Dickey-Fuller Stationary Test - Two or more variables – cross-correlation
Featured Functions:Function Description XCFTest Cross-Correlation Test JohansenTest Johansen Cointegration Test Chow Test Regression Stability Test CollinearityTest Test for the Presence of Multi-colinearity
See Also

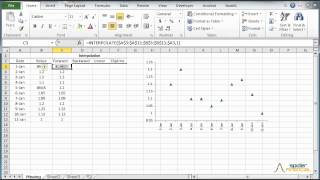
The construction of the curve may involve interpolation, where an exact fit to the data is required, or smoothing, in which the function is constructed that approximately fits the data.
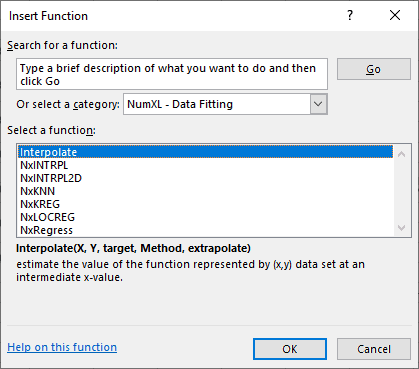
Discover a function that is an exact fit to the data points (assumes no measurement error). NumXL supports One and two-dimensional interpolation.
Featured Functions:
| Function | Description |
|---|---|
| NxINTRPL | Linear, polynomial, cubic spline Interpolation and Extrapolation |
| NxINTRPL2D | 2-Dimension-interpolation-extrapolation |
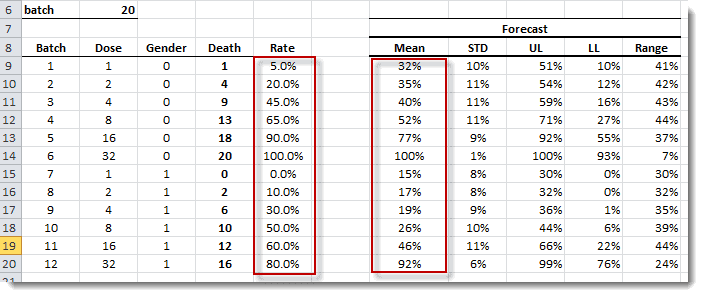
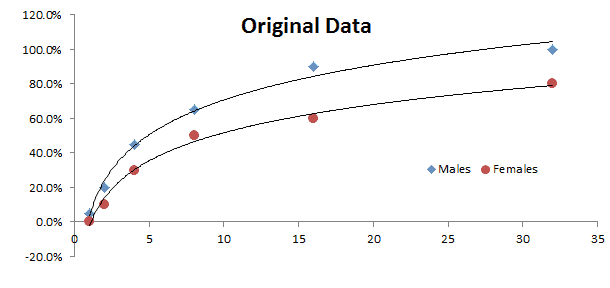
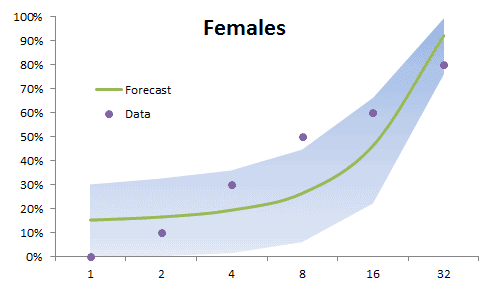
Find a curve-function that is an approximate fit to the data points: we permit the actual data points to be near, but not necessarily on the curve; while minimizing the overall error.
Featured Functions:
| Function | Description |
|---|---|
| NxRegress | Simple Linear Regression Function |
| NxKNN | K Nearest neighbors (K-NN ) Regression |
| NxKREG | Kernel Regression |
| NxLOCREG | Local or moving polynomial regression |
See Also
- Tutorial Videos
- Reference Manual
- User’s Guide
- Technical Notes
- Tips & Tricks
- Case Studies
Variable transformation is a common preliminary step in real-world analysis to get a more representative variable for the analysis.
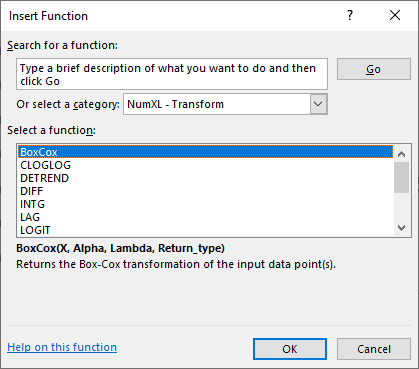
In some cases, you’d use a transform (e.g., Box-Cox) function, so the distribution of the values of your variable is closer to a normal distribution. In other cases, you’d use another transform (e.g., log) function to distribute the values of your variable better, hence avoiding any biases in your model.
Featured Functions:
| Function | Description |
|---|---|
| DIFF | Time Series Difference Operator |
| LAG | Time Series Lag or Backshift Operator |
| INTG | Time Series Integration Operator |
Featured Functions:
| Function | Description |
|---|---|
| BoxCox | Box-Cox Transform |
| CLOGLOG | Complementary Log-Log Transform |
| LOGIT | Logit Transform |
| PROBIT | Probit Transform |
| DETREND | Remove Deterministic Trend From Time Series |
Featured Functions:
| Function | Description |
|---|---|
| SUBNA | Missing values interpolation |
Featured Functions:
| Function | Description |
|---|---|
| RESAMPLE | Time series resampling |
See Also
- Tutorial Videos
- Reference Manual
- User’s Guide
- Technical Notes
- Tips & Tricks
- Case Studies
Featured Functions:
| Function | Description |
|---|---|
| NxSort | Sort input array |
| NxReverse | Reverse Chronicle Order of Time Series |
| NxShuffle | Shuffle the order of elements in data set |
Featured Functions:
| Function | Description |
|---|---|
| NxSubset | Time Series Subset |
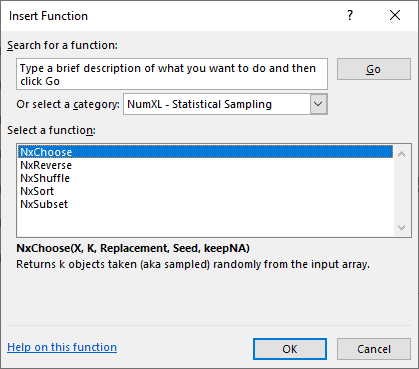
| NxChoose | Random sampling |
See Also
- Tutorial Videos
- Reference Manual
- User’s Guide
- Technical Notes
- Tips & Tricks
- Case Studies
Featured Functions:
| Function | Description |
|---|---|
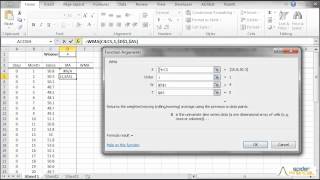
| NxEMA | exponentially-weighted moving (rolling/running) average |
| NxMA | Moving (rolling) average using prior data points |
| WMA | Weighted-Moving Average |
| NxCMA | Centered Moving-average Filter |
| NxSMA | Seasonal Moving-average Filter |
Featured Functions:
| Function | Description |
|---|---|
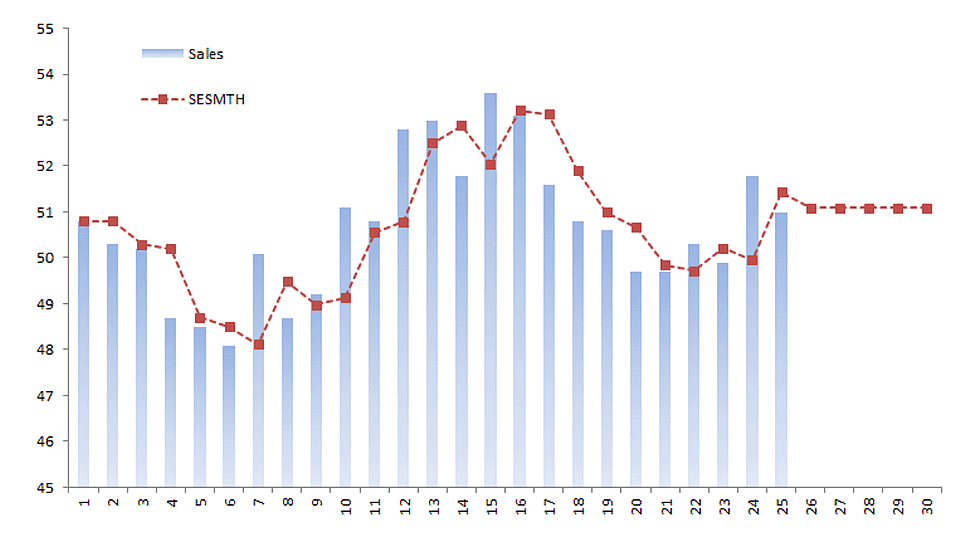
| SESMTH | (Brown’s) Simple Exponential Smoothing |
| LESMTH | (Brown’s) Linear Exponential Smoothing |
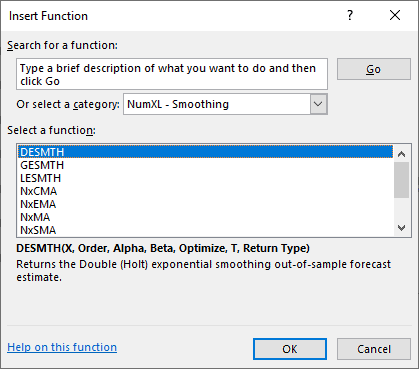
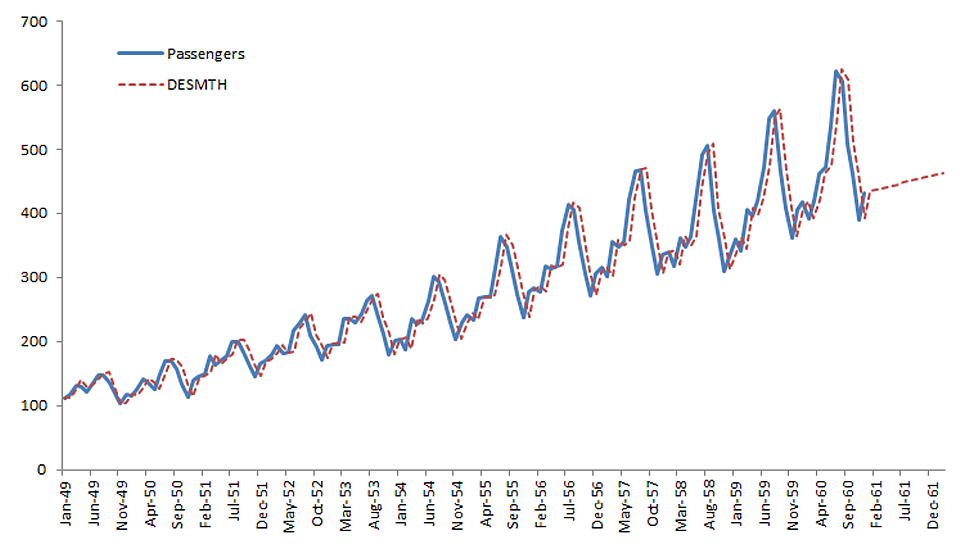
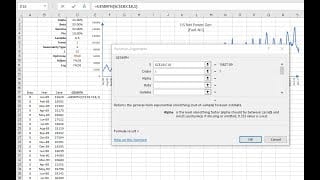
| DESMTH | (Holt’s) Double Exponential Smoothing |
| TESMTH | (Holt-Winters’s) Triple Exponential Smoothing |
| GESMTH | Generalized Exponential Smoothing Function |
Featured Functions:
| Function | Description |
|---|---|
| NxTrend | Deterministic trend in a time series |
See Also
- Tutorial Videos
- Reference Manual
- User’s Guide
- Technical Notes
- Tips & Tricks
- Case Studies

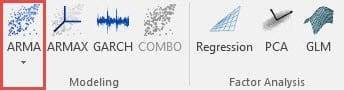
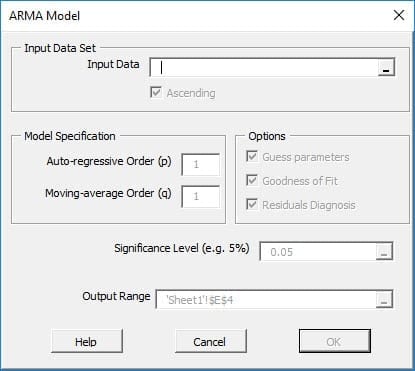
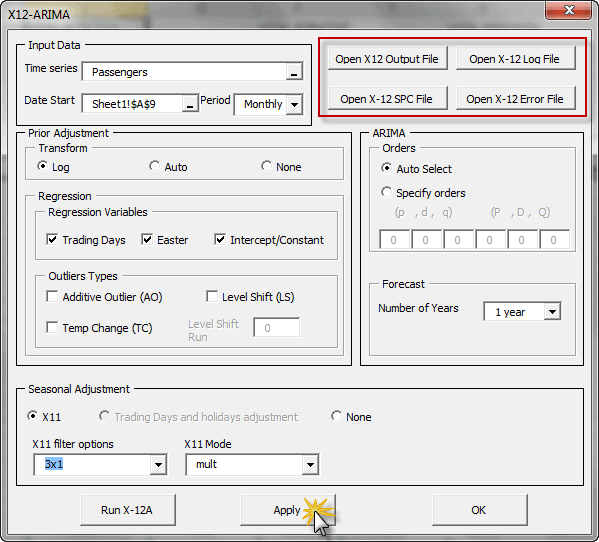
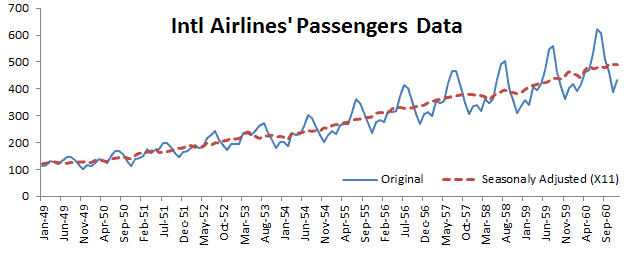
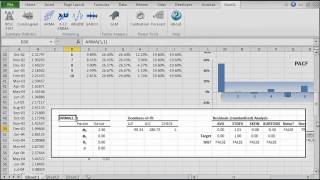
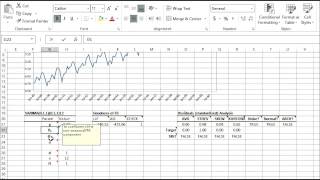
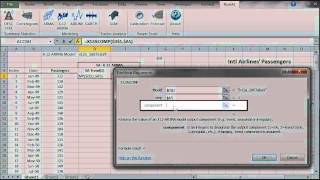
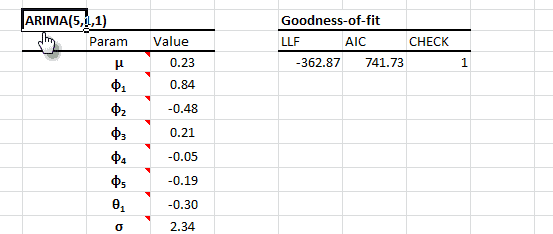
NumXL offers a wide selection of ARMA/ARIMA models such as ARMA (Autoregressive Moving Average), ARIMA (Autoregressive Integrated Moving Average), SARIMA (Seasonal Autoregressive Integrated Moving Average), ARMAX (Autoregressive Moving Average with Exogenous variables), SARIMAX, and US-Census X12-ARIMA.
- $x_t$ is the observed output at time t.
- $a_t$ is the innovation, shock or error term at time t.
- $p$ is the order of the last lagged variables.
- $q$ is the order of the last lagged innovation or shock.
- $a_t$ time series observations are independent and identically distributed (i.e. i.i.d) and follow a Gaussian distribution (i.e. $\Phi(0,\sigma^2)$)
Featured Functions:
| Function | Description |
|---|---|
| ARMA | Defining an ARMA model |
| ARMA_CHECK | Check parameters’ values for model stability |
| ARMA_PARAM | Values of the Model’s Parameters |
| ARMA_GOF | Goodness-of-fit of an ARMA Model |
| ARMA_FIT | ARMA Model Fitted Values |
| ARMA_FORE | Forecasting for ARMA Model |
| ARMA_SIM | Simulated values of an ARMA Model |
By definition, auto-regressive integrated moving average (ARIMA) is a stationary stochastic process made up of sums of auto-regressive and moving average components:
$y_t = (1-L)^d x_t$
Where
- $x_t$ is the original non-stationary output at time t.
- $y_t$ is the observed differenced (stationary) output at time t.
- $d$ is the integration order of the time series.
- $a_t$ is the innovation, shock, or error term at time t.
- $p$ is the order of the last lagged variables.
- $q$ is the order of the last lagged innovation or shock.
- $a_t$ time-series observations are independent and identically distributed
(i.e. i.i.d) and follow a Gaussian distribution (i.e. $\Phi(0,\sigma^2)$)
Featured Functions:
| Function | Description |
|---|---|
| ARIMA | Defining an ARIMA model |
| ARIMA_CHECK | Check parameters’ values for model stability |
| ARIMA_PARAM | Values of the Model’s Parameters |
| ARIMA_GOF | Goodness-of-fit of an ARIMA Model |
| ARIMA_FIT | ARIMA Model Fitted Values |
| ARIMA_FORE | Forecasting for ARIMA Model |
| ARIMA_SIM | Simulated values of an ARIMA Model |
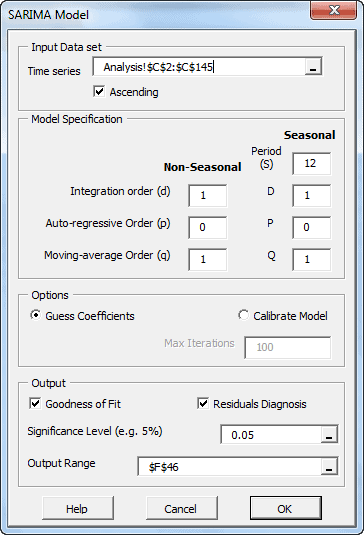
The SARIMA model is an extension of the ARIMA model, often used when we suspect a model may have a seasonal effect.
By definition, the seasonal auto-regressive integrated moving average process ( SARIMA(p,d,q)(P, D, Q)s ) is a multiplicative of two ARMA processes of the differenced time series.
(1-L^s)^D x_t = \\ (1+\sum_{i=1}^q {\theta_i L^i})(1+\sum_{j=1}^Q {\Theta_j L^{j
\times s}}) a_t$
$y_t = (1-L)^d (1-L^s)^D $
Where:
- $x_t$ is the original non-stationary output at time t.
- $y_y$ is the differenced (stationary) output at time t.
- $d$ is the non-seasonal integration order of the time series.
- $p$ is the order of the non-seasonal AR component.
- $P$ is the order of the seasonal AR component.
- $q$ is the order of the non-seasonal MA component.
- $Q$ is the order of the seasonal MA component.
- $s$ is the seasonal length.
- $D$ is the seasonal integration order of the time series.
- $a_t$ is the innovation, shock, or the error term at time t.
- $\{a_t\}$ time-series observations are independent and identically distributed
(i.e. i.i.d) and follow a Gaussian distribution (i.e. $\Phi(0,\sigma^2)$)
Featured Functions:
| Function | Description |
|---|---|
| SARIMA | Defining a SARIMA model |
| SARIMA_CHECK | Check parameters’ values for model stability |
| SARIMA_PARAM | Values of the Model’s Parameters |
| SARIMA_GOF | Goodness-of-fit of an ARIMA Model |
| SARIMA_FIT | ARIMA Model Fitted Values |
| SARIMA_FORE | Forecasting for SARIMA Model |
| SARIMA_SIM | Simulated values of a SARIMA Model |
The airline model is a special, but often used, case of multiplicative ARIMA model. For a given seasonality length (s), the airline model is defined by four(4) parameters: $\mu$, $\sigma$, $\theta$ and $\Theta$).
$ Z_t = (1-L^s)(1-L)Y_t = \mu + (1-\theta L)(1-\Theta L^s)a_t $ OR
$Z_t = \mu -\theta \times a_{t-1}-\Theta \times a_{t-s} +\theta\times\Theta \times a_{t-s-1}+ a_t $
Where:
- $s$ is the length of seasonality.
- $\mu$ is the model mean
- $\theta$ is the coefficient of first lagged innovation
- $\Theta$ is the coefficient of s-lagged innovation.
- $\left [a_t\right ] $ is the innovations time series.
Featured Functions:
| Function | Description |
|---|---|
| AIRLINE_CHECK | Check parameters’ values for model stability |
| AIRLINE_PARAM | Values of the Model’s Parameters |
| AIRLINE_GOF | Goodness-of-fit of an AIRLINE Model |
| AIRLINE_FIT | ARIMA Model Fitted Values |
| AIRLINE_FORE | Forecasting for AIRLINE Model |
| AIRLINE_SIM | Simulated values of an AIRLINE Model |
In principle, an ARMAX model is a linear regression model that uses an ARMA-type process (i.e. $w_t$) to model residuals:
$(1-\phi_1 L – \phi_2L^2-\cdots-\phi_pL^p)(y_t-\alpha_o -\beta_1 x_{1,t} – \beta_2 x_{2,t} – \cdots – \beta_b x_{b,t})= (1+ \theta_1 L + \theta_2 L^2 + \cdots + \theta_q L^q)a_t$
$(1-\phi_1 L – \phi_2 L^2 – \cdots – \phi_p L^p)w_t= (1+\theta_1 L+ \theta_2 L^2 + \cdots + \theta_q L^q ) a_t$
$a_t \sim \textrm{i.i.d} \sim \Phi (0,\sigma^2)$
- $L$ is the lag (aka back-shift) operator.
- $y_t$ is the observed output at time t.
- $x_{k,t}$ is the k-th exogenous input variable at time t.
- $\beta_k$ is the coefficient value for the k-th exogenous (explanatory)
input variable. - $b$ is the number of exogenous input variables.
- $w_t$ is the auto-correlated regression residuals.
- $p$ is the order of the last lagged variables.
- $q$ is the order of the last lagged innovation or shock.
- $a_t$ is the innovation, shock or error term at time t.
- $a_t$ time series observations are independent and identically distributed
(i.e. i.i.d) and follow a Gaussian distribution (i.e. $\Phi(0,\sigma^2)$)
Featured Functions:
| Function | Description |
|---|---|
| ARMAX | Defining an ARMAX model |
| ARMAX_CHECK | Check parameters’ values for model stability |
| ARMAX_PARAM | Values of the Model’s Parameters |
| ARMAX_GOF | Goodness of fit of an ARMAX Model |
| ARMAX_FIT | ARMAX Model Fitted Values |
| ARMAX_FORE | Forecasting for ARMAX Model |
| ARMAX_SIM | Simulated values of an ARMAX Model |
In principle, an SARIMAX model is a linear regression model that uses a SARIMA-type process (i.e. ) This model is useful in cases we suspect that residuals may exhibit a seasonal trend or pattern.
$(1-\sum_{i=1}^p {\phi_i L^i})(1-\sum_{j=1}^P {\Phi_j L^{j \times s}})(1-L)^d (1-L^s)^D w_t -\eta = \\ (1+\sum_{i=1}^q {\theta_i L^i})(1+\sum_{j=1}^Q {\Theta_j L^{j \times s}}) a_t$ $a_t \sim \textrm{i.i.d} \sim \Phi(0,\sigma^2)$
Where:
- $L$ is the lag (aka back-shift) operator.
- $y_t$ is the observed output at time t.
- $x_{k,t}$ is the k-th exogenous input variable at time t.
- $\beta_k$ is the coefficient value for the k-th exogenous (explanatory)
input variable. - $b$ is the number of exogenous input variables.
- $w_t$ is the auto-correlated regression residuals.
- $p$ is the order of the non-seasonal AR component.
- $P$ is the order of the seasonal AR component.
- $q$ is the order of the non-seasonal MA component.
- $Q$ is the order of the seasonal MA component.
- $s$ is the seasonal length.
- $D$ is the seasonal integration order of the time series.
- $\eta$ is a constant in the SARIMA model
- $a_t$ is the innovation, shock, or error term at time t.
- $\{a_t\}$ time-series observations are independent and identically distributed
(i.e. i.i.d) and follow a Gaussian distribution (i.e. $\Phi(0,\sigma^2)$)
Featured Functions
| Function | Description |
|---|---|
| SARIMAX | Defining a SARIMAX model |
| SARIMAX_PARAM | Values of the Model’s Parameters |
| SARIMAX_CHECK | Check parameters’ values for model stability |
| SARIMAX_GOF | Goodness-of-fit of a SARIMAX Model |
| SARIMAX_FIT | SARIMAX In-Sample Fitted Values |
| SARIMAX_FORE | Forecasting for SARIMAX Model |
| SARIMAX_SIM | Simulated values of a SARIMAX Model |
- $L$ is the Lag or the Backshift operator
- $s$ is the seasonal period
- $(\phi(L)=\phi_o+\phi_1 L+\phi_2 L^2 +\cdots +\phi_p L^p)$ is the nonseasonal auto-regressive (AR) model component
- $(\Phi(L)=\Phi_o+\Phi_1 L+\Phi_2 L^2 +\cdots +\Phi_P L^P)$ is the seasonal auto-regressive (AR) model component
- $(\theta(L)=\theta_o+\theta_1 L+\theta_2 L^2 +\cdots +\theta_q L^q)$ is the nonseasonal moving average (MA) model component
- $(\Theta(L)=\Theta_o+\Theta_1 L+\Theta_2 L^2 +\cdots +\Theta_Q L^Q)$ is the seasonal moving average (MA) model component
- $(1-L)^d$ is the non-seasonal differencing operator of order d
- $(1-L^s)^D$ is the seasonal differencing operator of order D and seasonal period (s)
- $\{a_t\}\sim \textrm{i.i.d}\sim N(0,\sigma^2)$
Featured Functions:
| Function | Description |
|---|---|
| X12ARIMA | Defining an X12-ARIMA Model |
| X12APROP | X11 Seasonal Adjustment and X12-ARIMA Model properties |
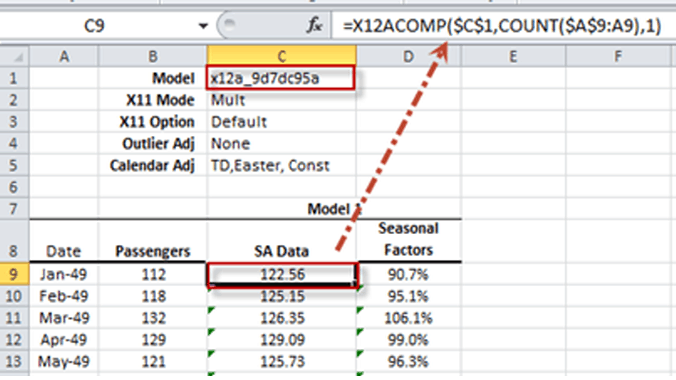
| X12ACOMP | X12-ARIMA Output Time Series |
| X12AFORE | Forecasting for X12-ARIMA Model |
The X-13ARIMA-SEATS software comes with extensive time series modeling and model selection capabilities for linear regression models with ARIMA errors (regARIMA models).
Furthermore, the X-13ARIMA-SEATS includes the capability to generate ARIMA model-based seasonal adjustment using a version of the SEATS software originally developed by Victor Gómez and Agustín Maravall at the Bank of Spain, as well as nonparametric adjustments from the X-11 procedure;
Featured Functions:
| Function | Description |
|---|---|
| X13AAS | Defining an X-13ARIMA-SEATS Model |
| X13ASCOMP | X-13ARIMA-SEATS output components time series |
| X13ASFORE | Forecasting for X13ARIMA-SEATS Model |
See Also
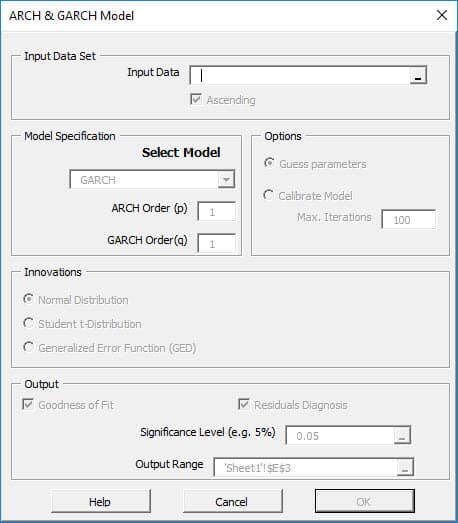
If an autoregressive moving average model (ARMA model) is assumed for the error variance, the model is a generalized autoregressive conditional heteroskedasticity (GARCH, Bollerslev(1986)) model.
$\sigma_t^2 = \alpha_o + \sum_{i=1}^p {\alpha_i a_{t-i}^2}+\sum_{j=1}^q{\beta_j \sigma_{t-j}^2}$
$a_t = \sigma_t \times \epsilon_t$
$\epsilon_t \sim P_{\nu}(0,1)$
Where
- $x_t$ is the time series value at time t.
- $\mu$ is the mean of GARCH model.
- $a_t$ is the model’s residual at time t.
- $\sigma_t$ is the conditional standard deviation (i.e. volatility)
at time t. - $p$ is the order of the ARCH component model.
- $\alpha_o,\alpha_1,\alpha_2,…,\alpha_p$ are the parameters of the
the ARCH component model. - $q$ is the order of the GARCH component model.
- $\beta_1,\beta_2,…,\beta_q$ are the parameters of the the GARCH
component model. - $\left[\epsilon_t\right]$ are the standardized residuals:
$\left[\epsilon_t\right] \sim i.i.d$
$E\left[\epsilon_t\right]=0$
$\mathit{VAR}\left[\epsilon_t\right]=1$ - $P_{\nu}$ is the probability distribution function for $\epsilon_t$.
Currently, the following distributions are supported:- Normal distribution
$P_{\nu} = N(0,1) $. - Student’s t-distribution
$P_{\nu} = t_{\nu}(0,1) $
$\nu \succ 4 $ - Generalized error distribution (GED)
$P_{\nu} = \mathit{GED}_{\nu}(0,1) $
$\nu \succ 1 $
- Normal distribution
Featured Functions:
| Function | Description |
|---|---|
| GARCH | Defining a GARCH model |
| GARCH_GUESS | Initial values for Model’s Parameters |
| GARCH_CHECK | Check parameters’ values for model stability |
| GARCH_LLF | Goodness-of-fit of a SARIMAX Model |
| GARCH_RESID | GARCH In-Sample (standardized) residuals |
| GARCH_FORE | Forecasting for GARCH Model |
| GARCH_SIM | Simulated values of a GARCH Model |
| GARCH_VL | Long-run Volatility of the GARCH Model |
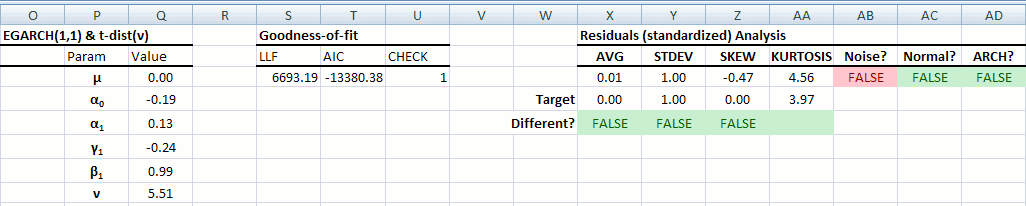
The exponential general autoregressive conditional heteroskedastic (EGARCH) is another form of the GARCH model. E-GARCH model was proposed by Nelson (1991) to overcome the weakness in GARCH handling of financial time series. In particular, to allow for asymmetric effects between positive and negative asset returns:
$\ln\sigma_t^2 = \alpha_o + \sum_{i=1}^p {\alpha_i \left(\left|\epsilon_{t-i}\right|+\gamma_i\epsilon_{t-i}\right )}+\sum_{j=1}^q{\beta_j \ln\sigma_{t-j}^2}$
$ a_t = \sigma_t \times \epsilon_t$
$ \epsilon_t \sim P_{\nu}(0,1)$
Where
- $x_t$ is the time series value at time t.
- $\mu$ is the mean of the GARCH model.
- $a_t$ is the model’s residual at time t.
- $\sigma_t$ is the conditional standard deviation (i.e. volatility) at time t.
- $p$ is the order of the ARCH component model.
- $\alpha_o,\alpha_1,\alpha_2,…,\alpha_p$ are the parameters of the ARCH component model.
- $q$ is the order of the GARCH component model.
- $\beta_1,\beta_2,…,\beta_q$ are the parameters of the GARCH component model.
- $\left[\epsilon_t\right]$ are the standardized residuals:
$ \left[\epsilon_t \right] \sim i.i.d$
$ E\left[\epsilon_t\right]=0$
$ \mathit{VAR}\left[\epsilon_t\right]=1$ - $P_{\nu}$ is the probability distribution function for $\epsilon_t$.
Currently, the following distributions are supported:- Normal Distribution
$P_{\nu} = N(0,1) $ - Student’s t-Distribution
$P_{\nu} = t_{\nu}(0,1) $
$\nu \gt 4 $ - Generalized Error Distribution (GED)
$P_{\nu} = \mathit{GED}_{\nu}(0,1) $
$\nu \gt 1 $
- Normal Distribution
Featured Functions:
| Function | Description |
|---|---|
| EGARCH | Defining an EGARCH model |
| EGARCH_GUESS | Initial values for Model’s Parameters |
| EGARCH_CHECK | Check parameters’ values for model stability |
| EGARCH_LLF | Goodness of fit of a EGARCH Model |
| EGARCH_RESID | EGARCH In-Sample (standardized) residuals |
| EGARCH_FORE | Forecasting for EGARCH Model |
| EGARCH_SIM | Simulated values of a EGARCH Model |
| EGARCH_VL | Long-run Volatility of the EGARCH Model |
In finance, the return of a security may depend on its volatility (risk). To model such phenomena, the GARCH-in-mean (GARCH-M) model adds a heteroskedasticity term into the mean equation. It has the specification:
$x_t = \mu + \lambda \sigma_t + a_t$
$\sigma_t^2 = \alpha_o + \sum_{i=1}^p {\alpha_i a_{t- i}^2}+\sum_{j=1}^q{\beta_j \sigma_{t-j}^2}$
$ a_t = \sigma_t \times \epsilon_t$
$ \epsilon_t \sim P_{\nu}(0,1)$
Where:
- $x_t$ is the time series value at time t.
- $\mu$ is the mean of the GARCH model.
- $\lambda$ is the volatility coefficient for the mean.
- $a_t$ is the model’s residual at time t.
- $\sigma_t$ is the conditional standard deviation (i.e. volatility) at time t.
- $p$ is the order of the ARCH component model.
- $\alpha_o,\alpha_1,\alpha_2,…,\alpha_p$ are the parameters of the ARCH component model.
- $q$ is the order of the GARCH component model.
- $\beta_1,\beta_2,…,\beta_q$ are the parameters of the GARCH component model.
- $\left[\epsilon_t\right]$ are the standardized residuals:
$ \left[\epsilon_t \right]\sim i.i.d$
$ E\left[\epsilon_t\right]=0$
$ \mathit{VAR}\left[\epsilon_t\right]=1$ - $P_{\nu}$ is the probability distribution function for $\epsilon_t$.
Currently, the following distributions are supported:- Normal Distribution
$P_{\nu} = N(0,1) $ - Student’s t-Distribution
$P_{\nu} = t_{\nu}(0,1) $
$\nu \gt 4 $ - Generalized Error Distribution (GED)
$P_{\nu} = \mathit{GED}_{\nu}(0,1) $
$\nu \gt 1 $
- Normal Distribution
Featured Functions:
| Function | Description |
|---|---|
| GARCHM | Defining a GARCH-M model |
| GARCHM_GUESS | Initial values for Model’s Parameters |
| GARCHM_CHECK | Check parameters’ values for model stability |
| GARCHM_LLF | Goodness-of-fit of a GARCH-M Model |
| GARCHM_RESID | GARCH-M In-Sample (standardized) residuals |
| GARCHM_FORE | Forecasting for GARCH-M Model |
| GARCHM_SIM | Simulated values of a GARCH-M Model |
| GARCHM_VL | Long-run Volatility of the GARCH-M Model |
See Also
A core assumption in econometric methods is that time-series observations are equally spaced and present. This arises either because observations are made deliberately at even intervals (continuous process) or because the process only generates outputs at such an interval in time (discrete process).
For example, a daily financial time series of IBM stock closing prices are based on the NYSE holidays calendar, so each observation is taken on an NYSE trading day (open/close). For weekly or monthly time series, the number of trading days varies from one observation to another and we may have to adjust for their effect.
Calendar events influence the values of the time series sample, and a prior adjustment for those events will help us to better understand the process, modeling, and forecast.
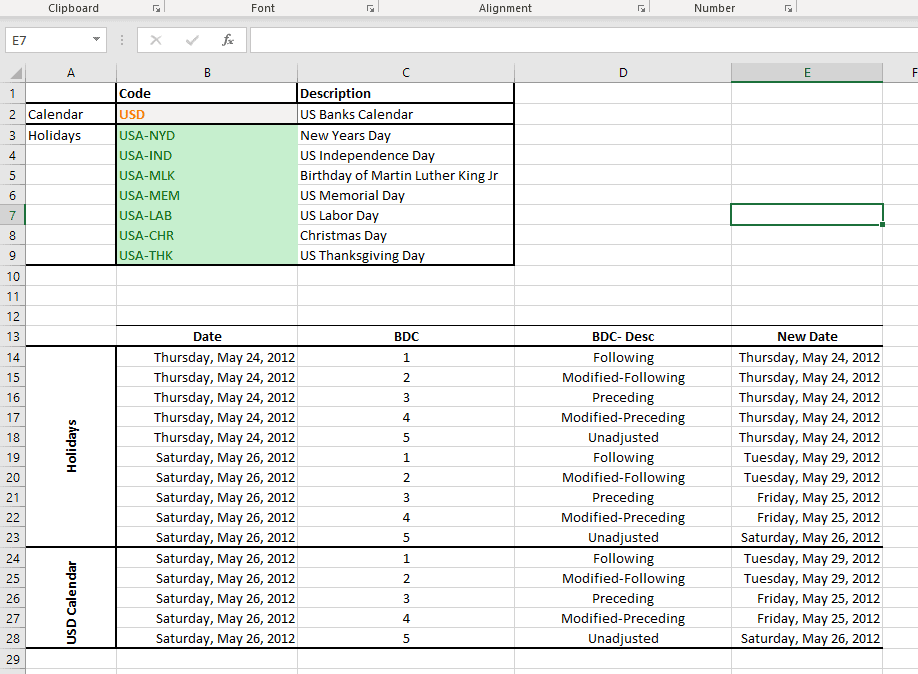
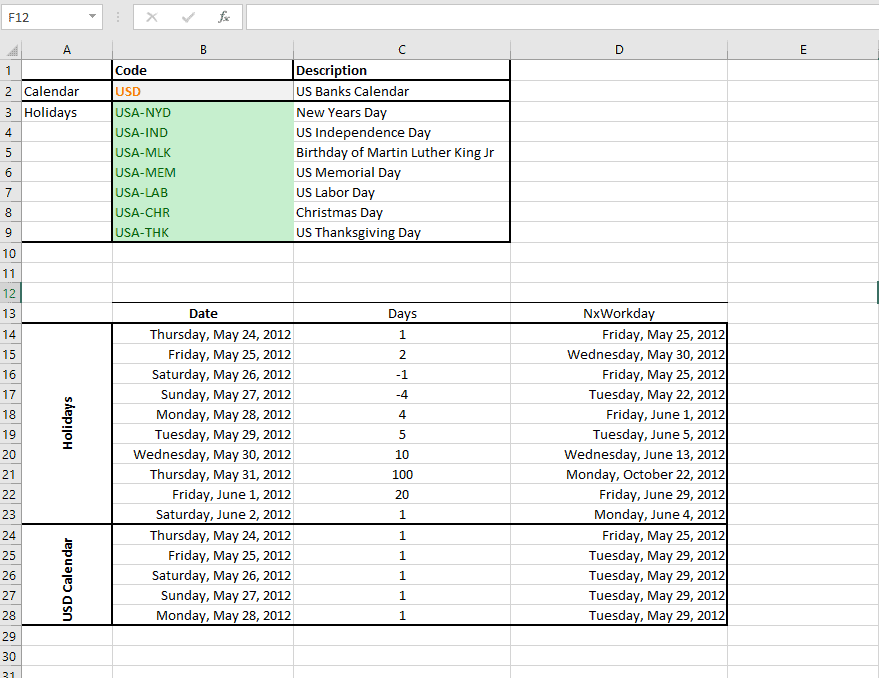
NumXL comes with numerous functions to support calendar adjustment, date rolling and adjustment, U.S. and non-U.S based holidays support, non-western weekends, and public and bank holiday calendars.
This date Calculation functions allow you to perform calculations with dates and periods like:
- Adding and subtracting periods in days, months and years
- Move a given date to the nearest workday using any of the industry business day counting conventions.
- Calculate the date of given n-th weekday occurrence (e.g. 3rd Friday) in any given month.
- more.
Featured Functions:
| Function | Description |
|---|---|
| NxAdjust | Move to the nearest workday |
| NxEDATE | Advance a date by a given period |
| NxNetWorkdays | Number of working days in a given date range |
| NxNWKDY | Date of the N-th Weekday in a Month |
| NxWKDYOrder | Order of the weekday for a given date |
| NxWorkday | Advance a given date N-Working Days |
Featured Functions:
| Function | Description |
|---|---|
| NxIsHoliday | Examine a given date if it falls on any holiday. |
| NxFindHLDY | Lookup the holiday name that falls on a given date |
| NxHLDYDate | Calculate the occurrence date of a given holiday in a given year. |
| NxHLDYDates | Lookup and return all holiday dates in a given date range. |
Featured Functions:
| Function | Description |
|---|---|
| NxWKNDStr | Weekend Code |
| NxWKNDUR | Weekend Duration |
| NxWKNDate | Next/Last Weekend date |
| NxWKNDNo | Weekend Convention Number |
| NxIsWeekend | Examine a given date whether it falls on a weekend. |
Featured Functions:
| Function | Description |
|---|---|
| NxCalendars | Returns a list of supported calendars with a given prefix (optional) |
| NxCALHolidays | Returns a list of supported holidays in a given calendar |
| NxCALWKND | Return the weekend convention for a given calendar. |
See Also
- Tutorial Videos
- Reference Manual
- User’s Guide
- Technical Notes
- Tips & Tricks
- Case Studies

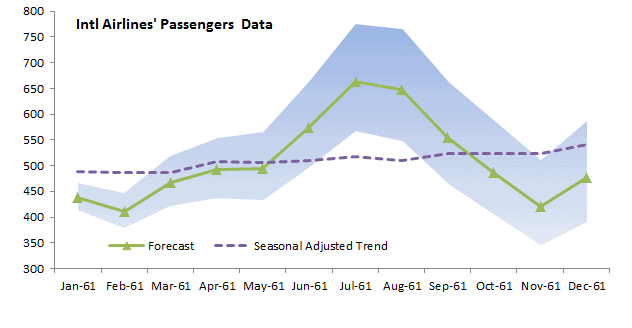
Forecasting is an ongoing process undertaken by several stakeholders to improve accuracy and reliability over time. To this end, the process’s output (i.e. forecast accuracy) should be quantified and monitored over time.
Furthermore, by quantifying forecast accuracy for competing models over time, you may use those metrics to compare (and rank) several forecasting methods or establish a baseline.
Featured Functions:
| Function | Description |
|---|---|
| SSE | Sum of squared errors |
| MSE | Mean of squared errors |
| GMSE | Geometric mean of squared errors |
| SAE | Sum of absolute errors |
| MAE | Mean of absolute erros |
| RMSE | Root mean squared errors |
| GRMSE | Geometric root mean squared errors |
Featured Functions:
| Function | Description |
|---|---|
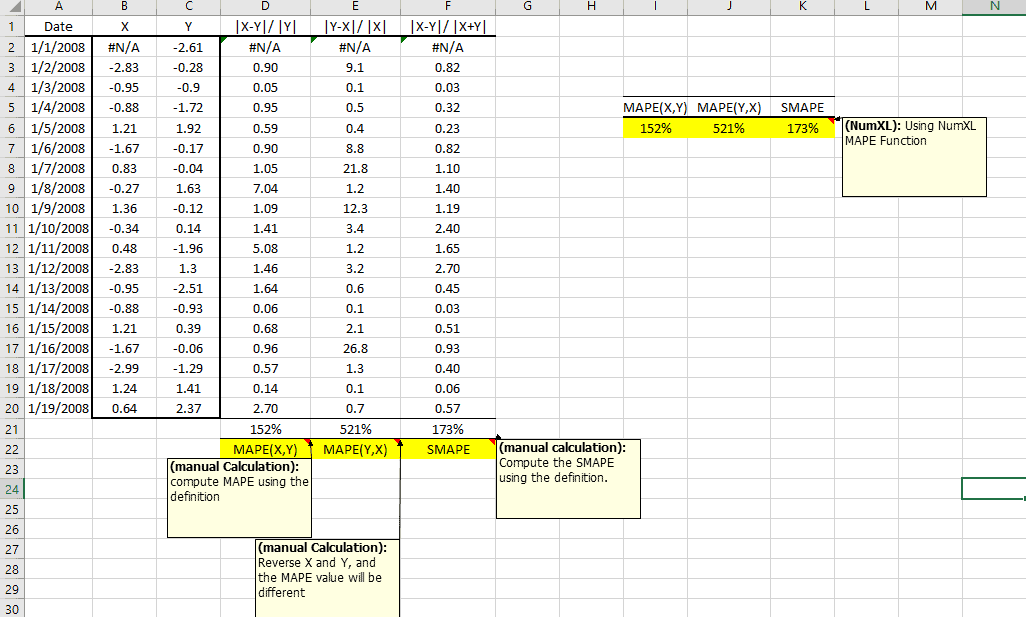
| MAPE | Mean absolute percentage error |
| MdAPE | Median absolute percentage error |
| MAAPE | Mean arctangent absolute percentage error |
Featured Functions:
| Function | Description |
|---|---|
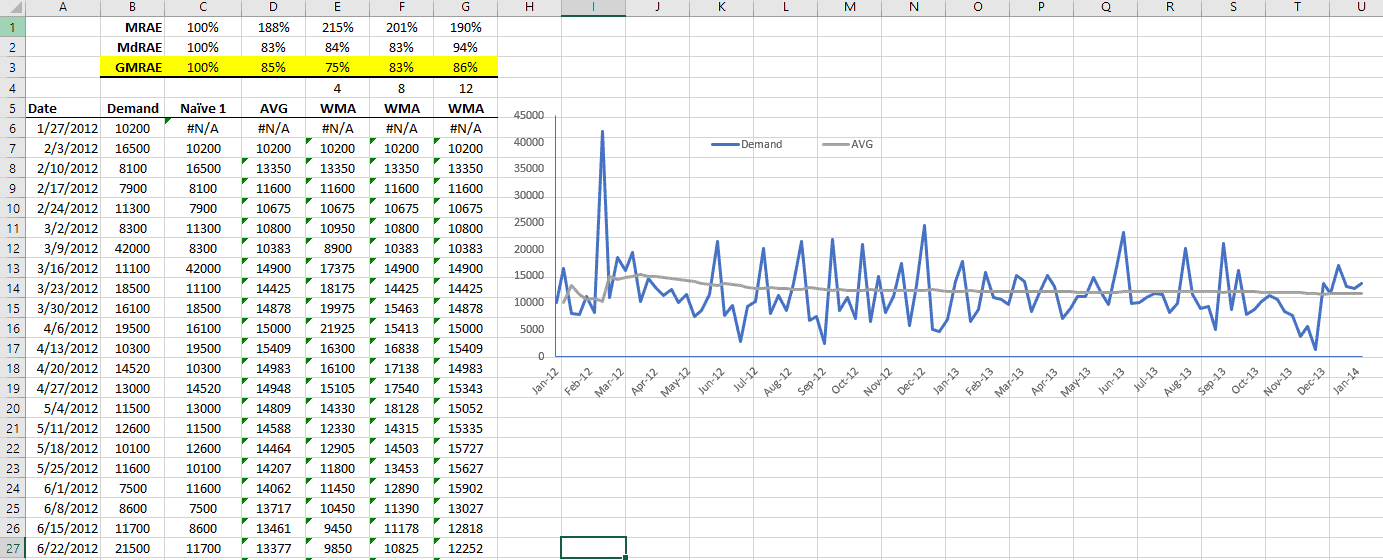
| MRAE | Mean relative absolute error |
| MdRAE | Median relative absolute error |
| GMRAE | Geometric mean relative absolute error |
| MASE | Mean absolute scaled error |
| PB | Percentage better |
| MDA | Mean directional accuracy |
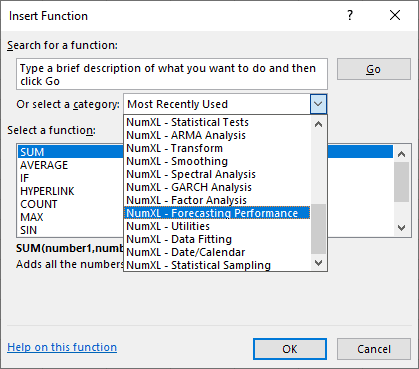
See Also
- Tutorial Videos
- Reference Manual
- User’s Guide
- Technical Notes
- Tips & Tricks
- Case Studies
Factor analysis is a useful tool to describe variability among observed, correlated variables in terms of a potentially lower number of unobserved, uncorrelated variables called factors.
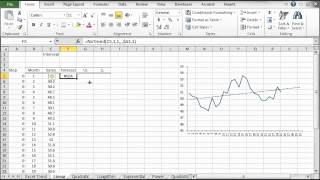
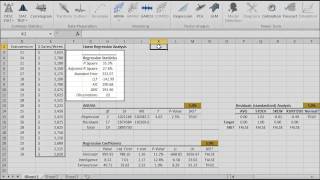
In statistics, simple linear regression is the least squares estimator of a linear regression model with a single explanatory variable. In other words, simple linear regression fits a straight line through the set of n points to make the sum of squared residuals of the model (that is, vertical distances between the points of the data set and the fitted line) as small as possible.
$$y = \alpha + \beta \times x$$
Where
- $\alpha$ is the constant (aka intercept) of the regression.
- $\beta$ is the explanatory variable’s coefficient (aka., slope).
Featured Functions:
| Function | Description |
|---|---|
| SLR_PARAM | Coefficients’ values for the SLR model |
| SLR_GOF | Goodness-of-fit (R^2, LLF, AIC) for SLR model |
| SLR_FITTED | Fitted values (mean and residuals) of the SLR model |
| SLR_FORE | Forecast (mean and error) of the SLR model |
| SLR_SNOVA | Analysis of Variance of the SLR model |
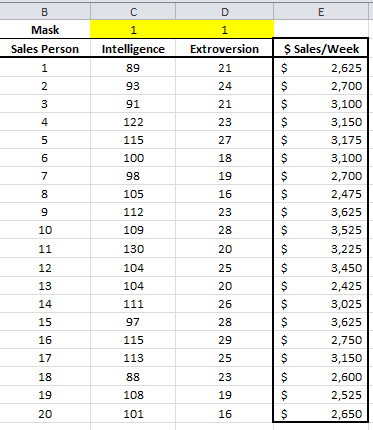
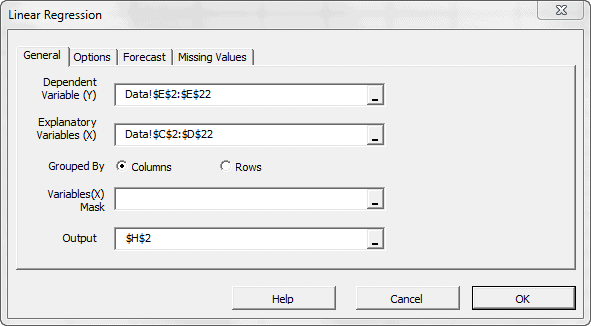
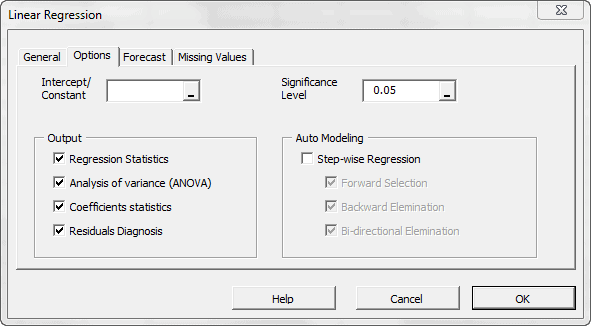
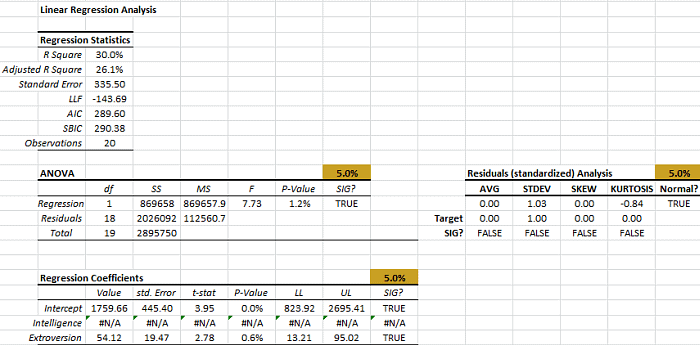
Given a data set $\{y_i,\, x_{i1}, \ldots, x_{ip}\}_{i=1}^n$ of n statistical units, a linear regression model assumes that the relationship between the dependent variable $y_i$ and the p-vector of regressors $x_i$ is linear. This relationship is modeled through a disturbance term or error variable $\epsilon_i$ — an unobserved random variable that adds noise to the linear relationship between the dependent variable and regressors.
$$ y_i = \beta_1 x_{i1} + \cdots + \beta_p x_{ip} + \varepsilon_i = \mathbf{x}^{\rm
T}_i\boldsymbol\beta + \varepsilon_i, \qquad i = 1, \ldots, n, $$
Where
- $\mathbf{x}^{\rm T}_i$ is the transpose matrix
Featured Functions:
| Function | Description |
|---|---|
| MLR_PARAM | Coefficients’ values of the MLR model |
| MLR_GOF | Goodness of fit of MLR model |
| MLR_FITTED | Fitted (mean and residuals) values of MLR model |
| MLR_FORE | Forecasting (mean, error, C.I.) for MLR model |
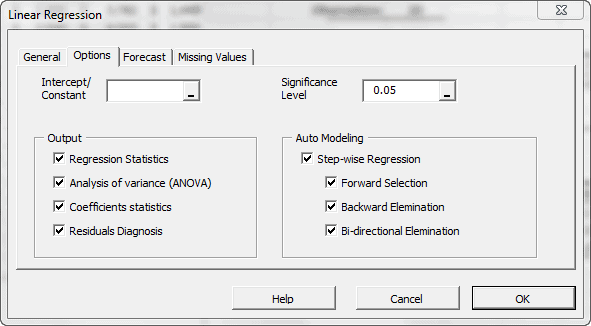
| MLR_ANOVA | Analysis of Variance for MLR model |
| MLR_PRTest | Partial F-Test for regression variables |
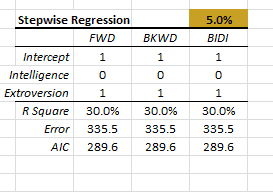
| MLR_STEPWISE | Regression variables selection method (stepwise) |
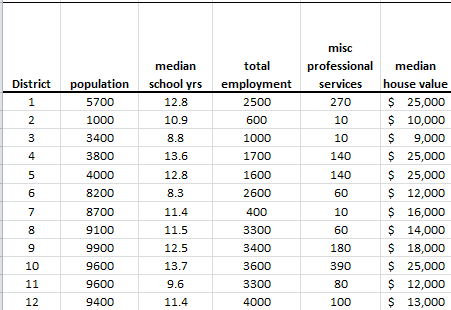
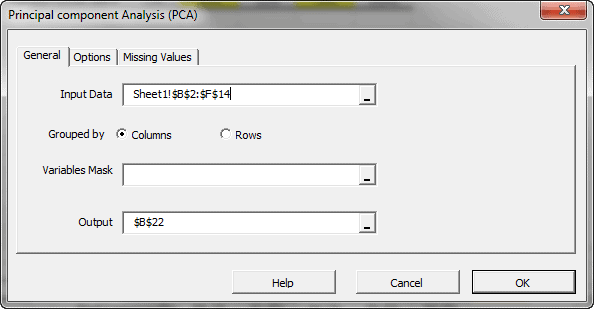
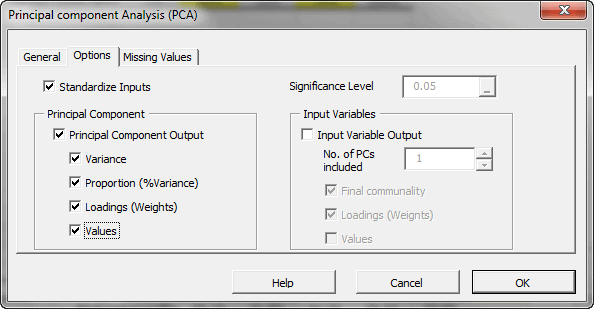
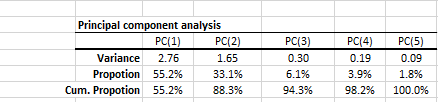
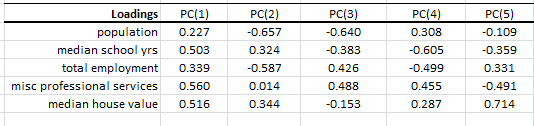
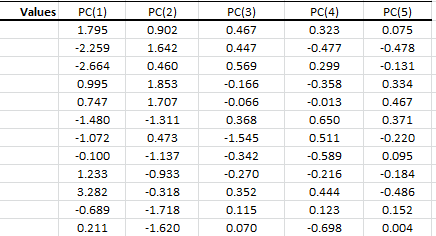
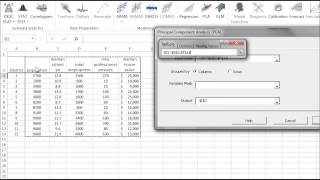
Principal component analysis (PCA) is a mathematical procedure that uses an orthogonal linear transformation to convert a set of observations of possibly correlated variables into a set of values of linearly uncorrelated variables called principal components.
variable and each row corresponds to a different repetition (or measurement) of the experiment:
$$\mathbf{X} = \begin{pmatrix} \mathbf{x}^{\rm T}_1 \\ \mathbf{x}^{\rm T}_2
\\ \vdots \\ \mathbf{x}^{\rm T}_n \end{pmatrix} = \begin{pmatrix} x_{11}
& \cdots & x_{1p} \\ x_{21} & \cdots & x_{2p} \\ \vdots &
\ddots & \vdots \\ x_{n1} & \cdots & x_{np} \end{pmatrix} $$
$$ \mathbf{Y}^{\rm T} = \mathbf{X}^{\rm T}\mathbf{W} $$
can express the PCA transformation as
$$ \mathbf{Y}^{\rm T} = (\mathbf{W}\mathbf{\Sigma}\mathbf{V}^{\rm T})^{\rm T}\mathbf{W}$$
Where:
- $\mathbf{W}$ is the matrix of eigenvectors of the covariance matrix $\mathbf{X}
\mathbf{X}^{\rm T}$ - $\mathbf{V}$ is the matrix of eigenvectors of the matrix $\mathbf{X}^{\rm
T} \mathbf{X}$ - $\mathbf{\Sigma}$ is a rectangle matrix with nonnegative real numbers
on the diagonal
$ \mathbf{Y}^{\rm T} = \mathbf{V}\mathbf{\Sigma}^{\rm T} $
Featured Functions:
| Function | Description |
|---|---|
| PCA_COMP | Principal component (PC) values |
| PCA_VAR | Calculate the variable values using a subset of the principal components. |
Featured Functions:
| Function | Description |
|---|---|
| PCR_PARAM | Calculate the coefficients’ values (end std. errors) for the PCR model |
| PCR_GOF | Calculate the goodness-of-fit (e.g., R^2, LLF, AIC) for the PCR model. |
| PCR_ANOVA | Conduct the Analysis of Variance (ANOVA) for the PCR model. |
| PCR_FITTED | Calculate the in-sample fitted values (mean, residuals) for the PCR model. |
| PCR_FORE | Forecasting (mean, error, and C.I.) for the PCR model. |
| PCR_PRTest | Partial F-Test for PCR. |
| PCR_STEPWISE | Perform the stepwise variables selection method. |
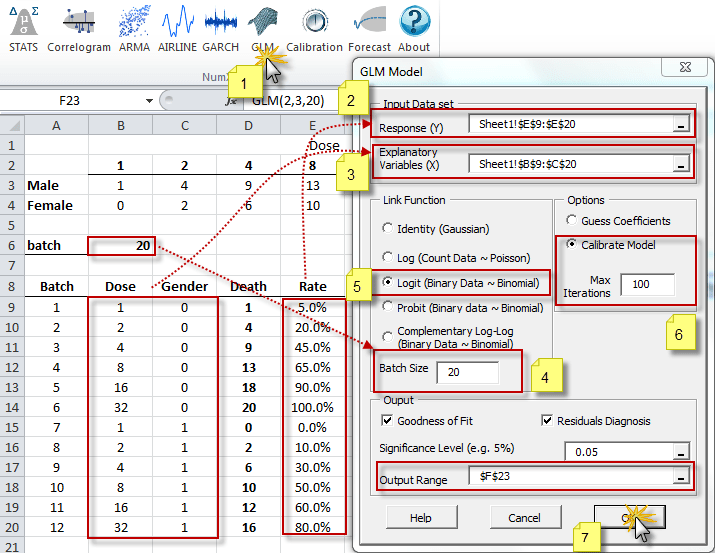
The generalized linear model (GLM) is a flexible generalization of ordinary least squares regression. The GLM generalizes linear regression by allowing
the linear model to be related to the response variable (i.e., $Y$) via a
link function (i.e. $g(.)$)and by allowing the magnitude of the variance
of each measurement to be a function of its predicted value.
$$Y = \mu + \epsilon $$
And
$$ E\left[Y\right]=\mu=g^{-1}(X\beta) = g^{-1}(\eta)$$
Where
- $\epsilon$ is the residual or deviation from the mean
- $g(.)$ is the link function
- $g^{-1}(.)$ is the inverse-link function
- $X$ is the independent variables or the exogenous factors
- $\beta$ is a parameter vector
- $\eta$ is the linear predictor: the quantity which incorporates
the information about the independent variables in the model.
$\eta=X\beta$
Featured Functions:
| Function | Description |
|---|---|
| GLM | GLM model definition |
| GLM_CHECK | Verify the parameters’ values of the GLM model |
| GLM_GUESS | Calculate a rough but valid set of coefficient values for the given GLM model. |
| GLM_CALIBRATE | Calculate the GLM-optimized model coefficient values (and errors). |
| GLM_LLF | Calculate the log-likelihood function (LLF) for the GLM Model. |
| GLM_MEAN | Calculate the in-sample fitted value of the GLM Model |
| GLM_RESID | Calculate the in-sample error terms/residuals for the GLM model |
| GLM_FORE | Calculate the mean forecast of the GLM Model |
| GLM_FORECI | GLM Forecasting Confidence Interval |
See Also
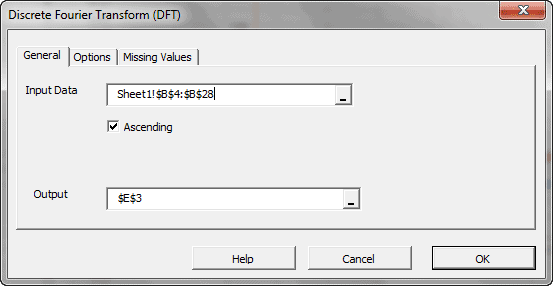
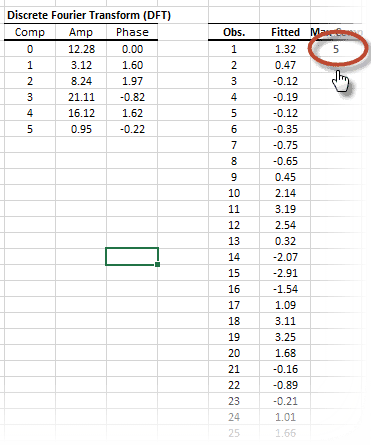
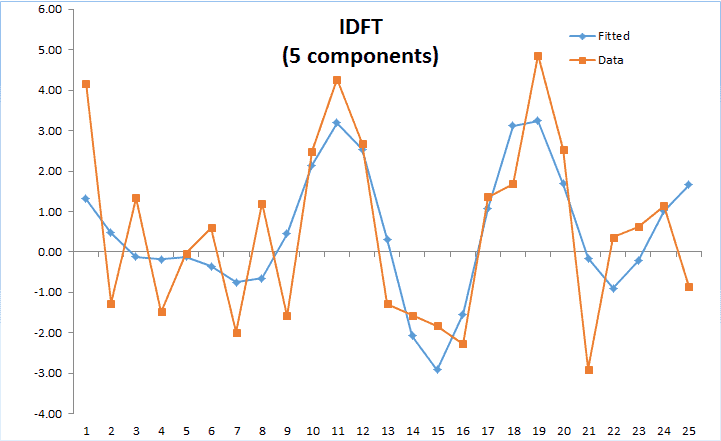
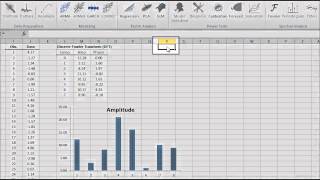
In principle, the DFT converts a discrete set of observations into a series of continuous trigonometric (i.e. sine and cosine) functions. So the original signal can be represented as:
Where
- $k$ is the frequency component
- $x_0,…,x_{N-1}$ are the values of the input time series
- $N$ is the number of non-missing values in the input time series
k \lt \frac{N}{2} \\ E_{\left (k-\frac{N}{2} \right )} – \ \alpha
\cdot O_{\left (k-\frac{N}{2} \right )} & \text{ if } k \geq
\frac{N}{2} \end{cases} $
Where
- $E_k$ is the DFT of the even-indicied values of the input time series, $x_{2m} \left(x_0, x_2, \ldots, x_{N-2}\right)$
- $O_k$ is the DFT of the odd-indicied values of the input time series, $x_{2m+1} \left(x_1, x_3, \ldots, x_{N-2}\right)$
- $\alpha = e^{ \left (-2 \pi i k /N \right )}$,
- $N$ is the number of non-missing values in the time series data.
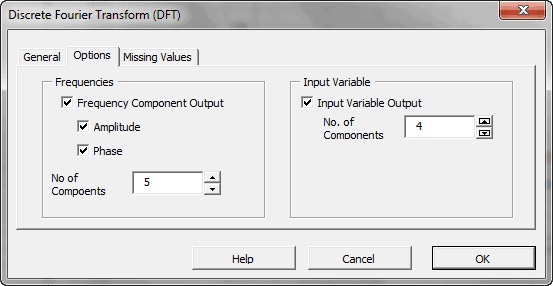
Featured Functions:
| Function | Description |
|---|---|
| DFT | Calculate the Discrete (Fast) Fourier Transform |
| IDFT | Calculate the Inverse Discrete Fourier Transform |
The filters functions decompose the time series into a trend and cyclical components.
Featured Functions:
| Function | Description |
|---|---|
| NxBK | Apply the Baxter-King filter |
| NxHP | Apply Hodrick-Prescott filter |
| NxConv | Compute the convolution operator between the two time-series. |
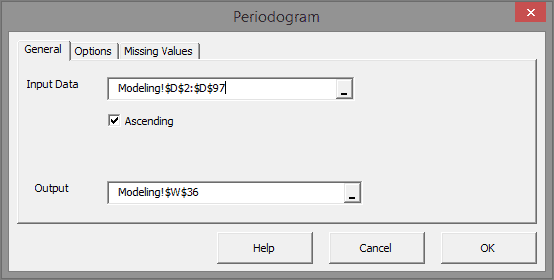
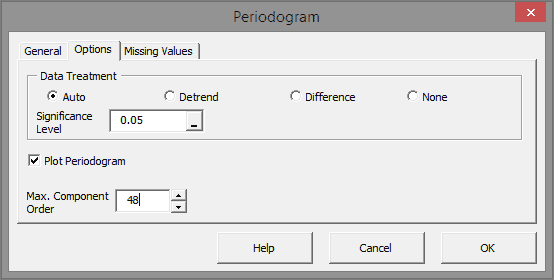
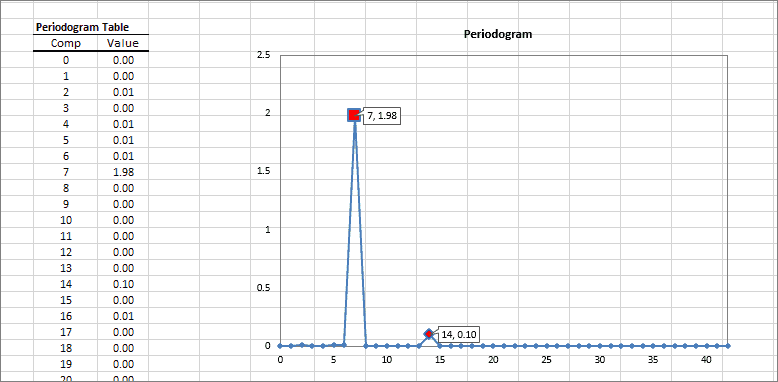
A periodogram is an estimate of the power spectral density of a time series. This method is useful to identify dominant seasonality in the underlying data set.
Featured Functions:
| Function | Description |
|---|---|
| Periodogram | Calculates the Power Spectral Density (PSD) estimate. |
See Also
- Tutorial Videos
- Reference Manual
- User’s Guide
- Technical Notes
- Tips & Tricks
- Case Studies
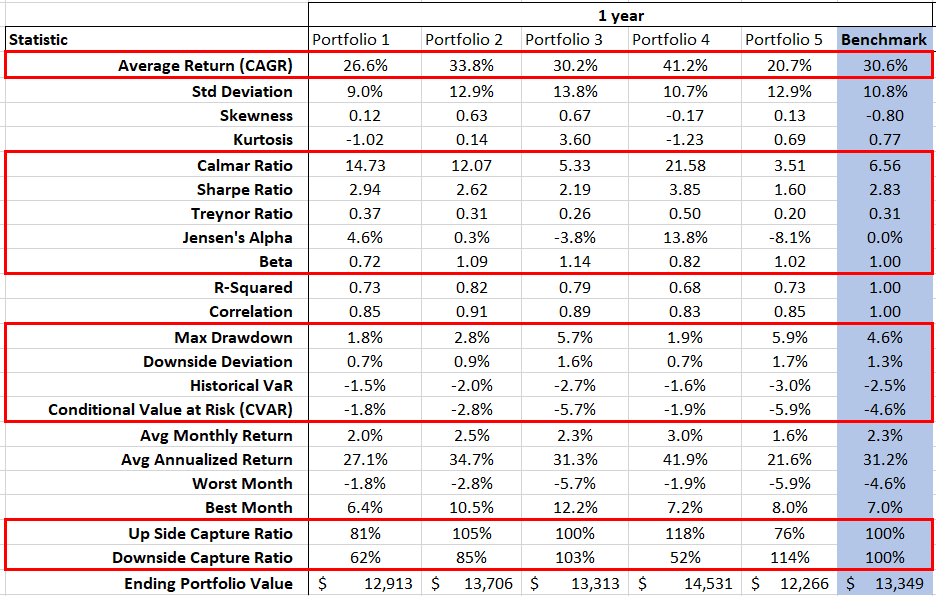
Analyze portfolio for returns, variance, and covariance, simulate correlation of assets and calculate portfolio value at risk (VaR).
Featured Functions:
| Function | Description |
|---|---|
| NxVaR | Returns the historical/theoretical value at risk (VaR). |
| NxDWS | Returns the downside deviation of a given data set. |
| NxCVaR | Returns the historical/theoretical conditional value at risk (CVaR). |
| NxCAPM | Returns the Capital Asset Pricing Model (CAPM) beta. |
| NxCalmar | Returns the Calmar ratio. |
| NxSharpe | Returns the Sharpe ratio. |
| NxMCR | Returns the upside and downside market capture ratio (MCR). |
| NxJensen | Returns the Jensen’s alpha measure in annual percentage rate (APR). |
| NxMDD | Returns the maximum drawdown (MDD) in the given time series data set. |
| NxCAGR | Returns the compound annual growth rate. |
| NxTreynor | Returns the Treynor ratio. |
See Also
- Tutorial Videos
- Reference Manual
- User’s Guide
- Technical Notes
- Tips & Tricks
- Case Studies
In this section, we present a set of tools available on the NumXL toolbar as shortcuts for:
- calibrating the values of your underlying model (e.g. ARMA, GARCH, GLM, etc,) using MS Solver.
- Creating an out-of-sample model-based forecast,
- Running model-based simulation
- Running MC simulation
Using the currently active cell, the calibration tool detects the underlying model, Invoke and Setup MS Solver’s fields (e.g. utility function, parameters to optimize for, constraints, etc.) with calculations in the selected model table for the optimization problem.
Using the currently active cell, the forecasting wizard detects the underlying model, and displays proper UI to collected required inputs (e.g. most-recent realized observation, forecast horizon, significance level, etc.) from the end-user, and, finally, generate an output forecast table with proper C.I.
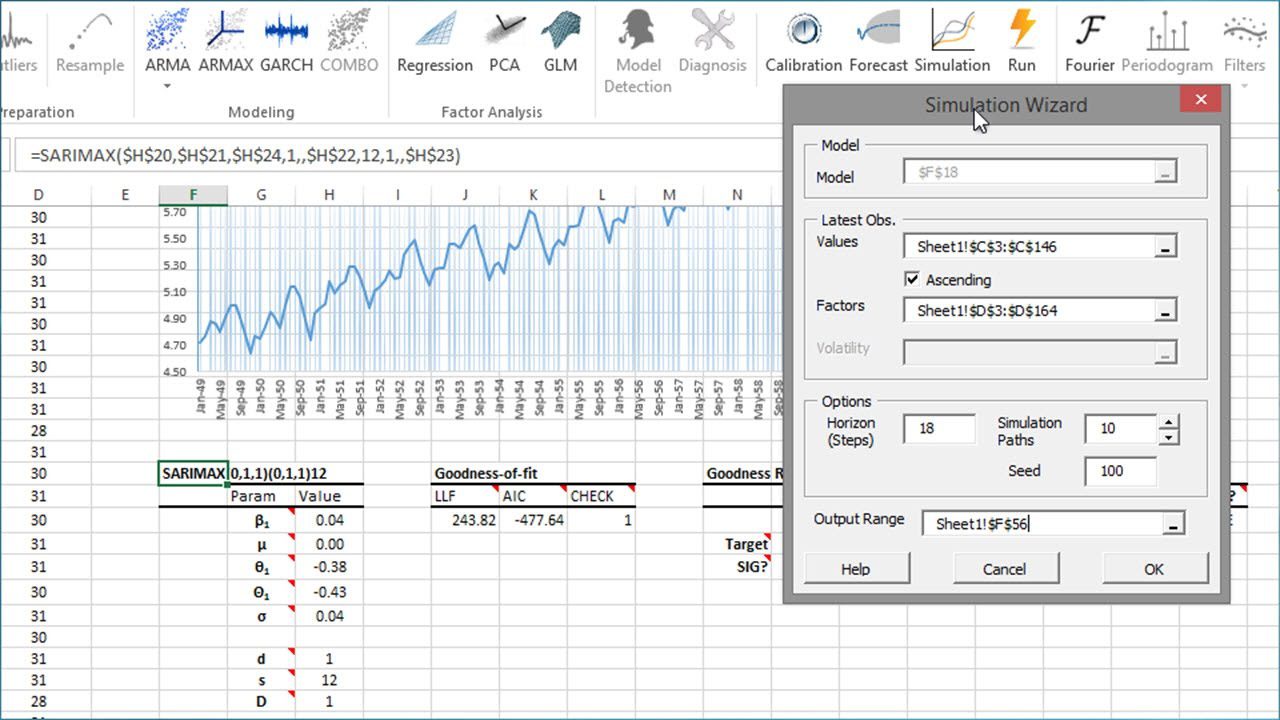
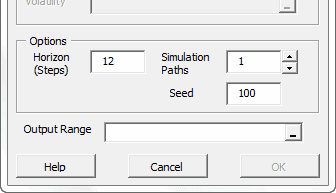
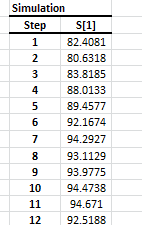
Using the currently active cell, the Simulation wizard detects the designated model and pops proper UI to collect required inputs (e.g. recently realized observations, horizon, number of simulation paths, etc.) from the end-user, and generate the simulations paths.
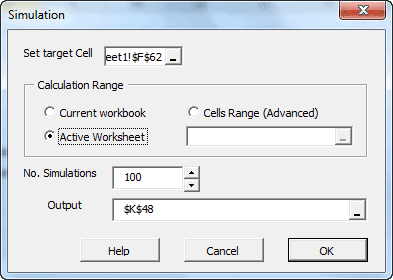
This functionality is similar to Excel’s data-table concept, except there is no set of predefined cells’ values to calculate for. Instead, assuming you have one or more cells with volatile (i.e. random) values (and your output calculation(s) affected by those cells), the MC simulation functionality simply forces Excel to re-calculate designated workbook/worksheet/cells range, and capture the outputs in each run into a designated cells range.
See Also
- Tutorial Videos
- Reference Manual
- User’s Guide
- Technical Notes
- Tips & Tricks
- Case Studies


Need more tools to prepare your data set? Run regular expressions for match and/or replace, split/tokenize string, examine the presence of missing values and transform 2-D data sets.
A regular expression (shortened as regex)is a sequence of characters that define a search pattern. The pattern can be applied:
- (Match) Matching against a given text/string for a possible match, and, if desired,
- (Extract) Identify and extract substring.
- (Replace) Identify and substitute one (or all) occurrence of a substring with another value
- (Tokenize): Split the text into a series of substrings, using a given separator pattern.
Featured Functions:
| Function | Description |
|---|---|
| NxMatch | Regular Expression (regex) Match Function |
| NxReplace | Regular Expression (regex) Replace Function |
| NxTokenize | Separate a string by a delimiter into an array of sub-strings |
Featured Functions:
| Function | Description |
|---|---|
| HASNA | Check input for observations with missing Value |
| RMNA | Remove Missing Values |
| MV_OBS | Number of observations with non-missing values |
| MV_VARS | Effective Number of Variables |
The functions in the category operate on one(1) or two(2) dimensional data cells. They are very useful, especially when we handle missing values, interpolation, and/or selecting a subset of input variables.
Featured Functions:
| Function | Description |
|---|---|
| NxArray | Create an array using constants and/or cells references |
| NxFold | Convert a 3-column dataset into a 2-D table or matrix |
| NxFlatten | collapse a data table into a flat 3-column dataset form |
| NxTranspose | Convert row to column (and vice versa) |
Featured Function:
| Function | Description |
|---|---|
| NUMXL_INFO | Retrieves NumXL’s installation information. |
See Also
- Tutorial Videos
- Reference Manual
- User’s Guide
- Technical Notes
- Tips & Tricks
- Case Studies
Customers Reviews