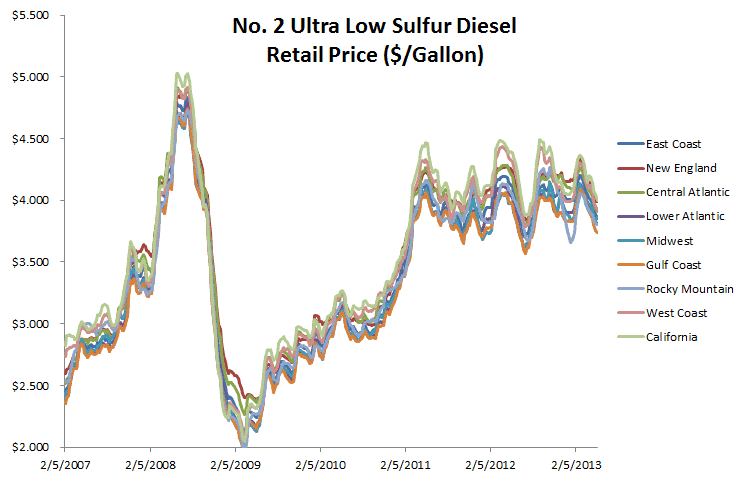
In this case study, we examine closely the highway retail price ($/Gallon) for “No.2 Ultra Low Sulfur (0-15 ppm) Diesel” in the EIA nine (9) PADD regions. We carry on principal component analysis in an attempt to find a minimal subset of the principal components that capture (or explains) the variation (spreads) in prices across different regions with a minimal loss of information.
The sample data start on February 5th, 2007 and end on May 6th, 2013 (327 observations). Each observation represents the weekly average prices in nine regions:
- East Coast
- New England
- Central Atlantic (PADD 1B)
- Lower Atlantic (PADD 1C)
- Midwest
- Gulf Coast
- Rocky Mountain
- West Coast
- California
The weekly prices across the different regions are highly correlated:
In this study, we’ll investigate the drivers behind the price variation among the different regions, and attempt to imply the physical representation of those components using the each region’s price loadings.
Process
Now we are ready to conduct our principal component analysis. First, select an empty cell in your worksheet where you wish the output to be generated, then locate and click on the principal component (PCA) icon in the NumXL tab (or toolbar).
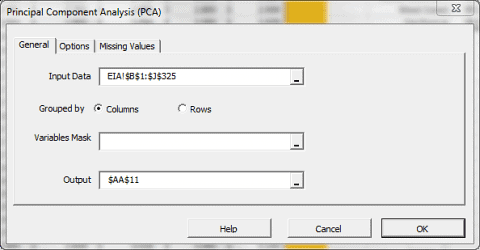
The principal component analysis wizard appears.
Select the cells range for the five input variable values.
Notes:
- Leave out the last three observations, so our input data ends on April 15th, 2013. The remaining three points will be used for comparing the forecast values later on.
- Leave the “Variables Mask” field blank for now. We will revisit this field in later entries.
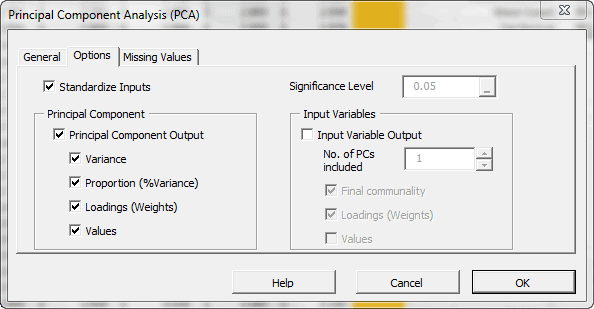
Next, select the “Options” tab.
- “Standardize Inputs” is checked. Leave this option checked.
- “Principal Component Output” is checked. Leave it checked.
- The significance level (aka. $\alpha$) is set to 5%.
- Under “principal component,” check the “Values” option, so the generated output tables include the principal component values for different dates.
- “Input Variables” is unchecked. Leave it unchecked.
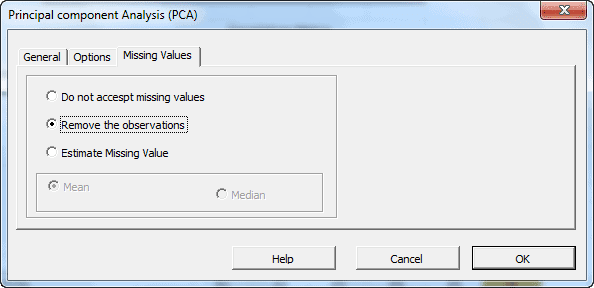
In this tab, you can select an approach to handle missing values in the data set (X). By default, any missing value found in any observation would exclude the observation from the analysis.
This treatment is a good approach for our analysis, so let’s leave it unchanged.
Now, click “OK” to generate the output tables.
Analysis
1. Statistics
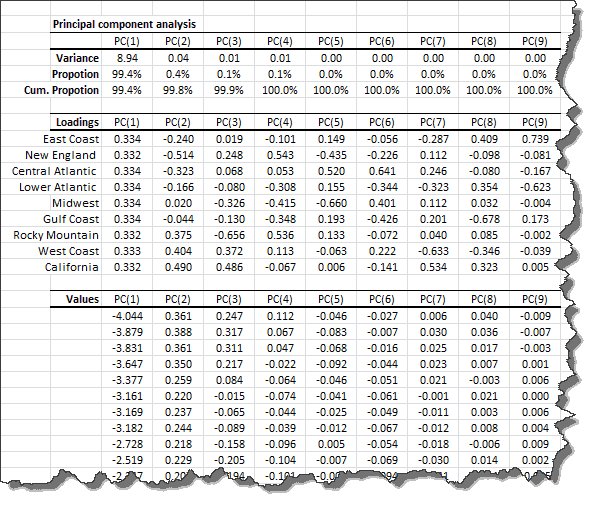
In the table above, we show the variance of each principal component and the proportion of the input (standardized) data set’s total variance variable that it accounts for. Examining the table closer, the 1st two components capture 99.8% of the data set variation.
2. Loadings
In the loadings table, we outline the weights of the principal component in each input variable:
Examining the input variables (i.e. region price) loadings for the first component shows a uniform loading for all variables. This can be interpreted as the level-factor (price that is locale-neutral).
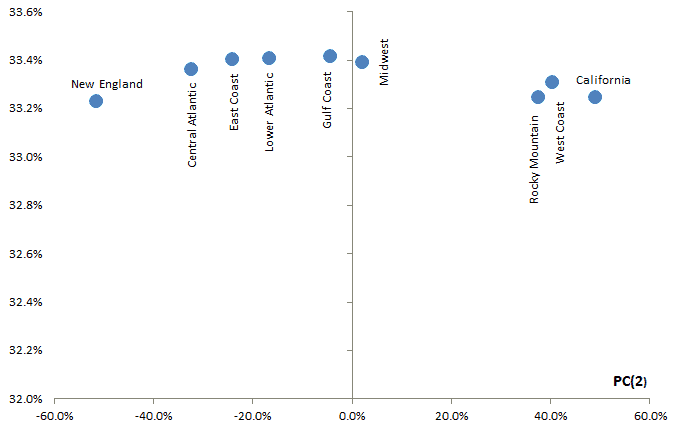
For the second factor, the picture is a bit different:
- For all PADD regions in the east, the loading is negative.
- For PADD regions in the west, the loading is positive.
- Gulf coast’s loading is slightly negative.
- Midwest loading is slightly positive.
This factor’s loading can be viewed as proximity to (or availability of) refinery capacity or import ports (example: New York harbor). The second factor reflects the cost of transportation and tax of the fuel.
Note: The loadings of the input variables for the 1st component are very comparable, so, in effect, the second component (factor) is what drives the price differential between the different PADD regions.
3. Principal Components Values
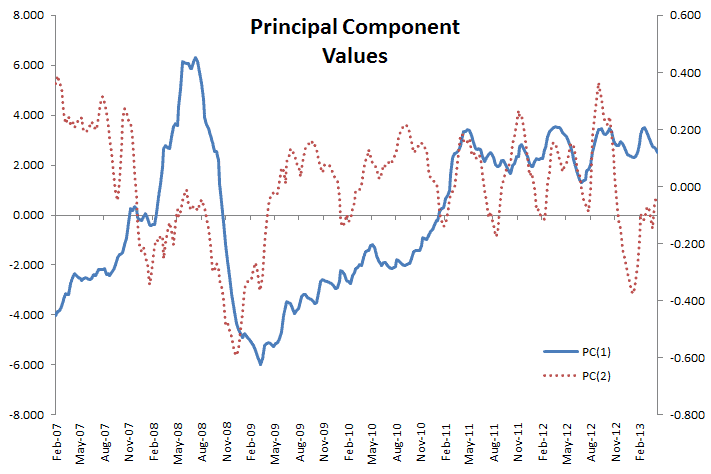
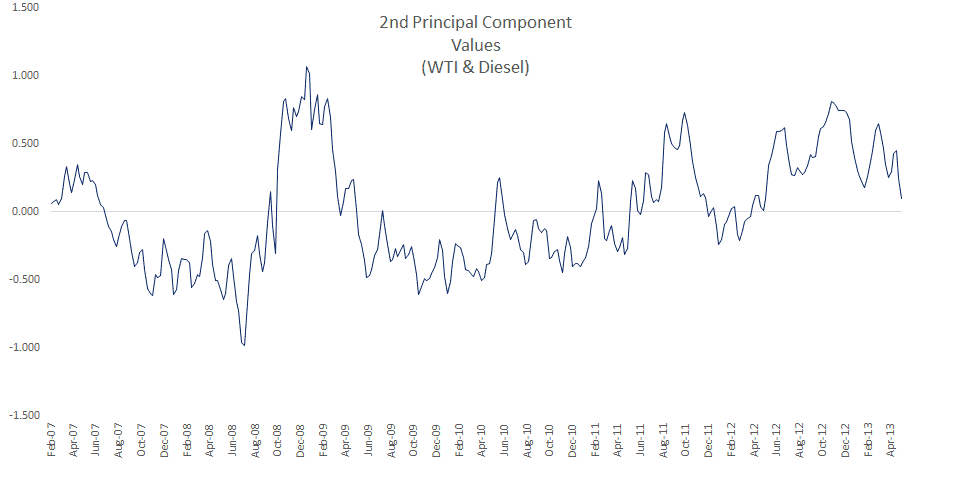
Let’s examine the values of the first two principal components.
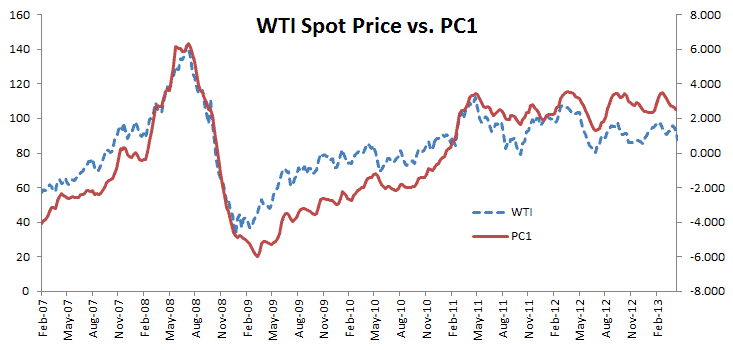
The two time series exhibit some seasonality, although it is more apparent in the second factor. Furthermore, the first principal component exhibits a pattern close to crude oil prices.
NOTE: The lack of an exact match may be attributed to other costs incurred in the making of No. 2 Ultra Low Sulfur Diesel: labor, energy prices, raw material, etc. Furthermore, refineries build up inventory of products (e.g. diesel) in anticipation of the seasonal demand peaks, so there may be a lag.
4. Adding WTI Spot Prices
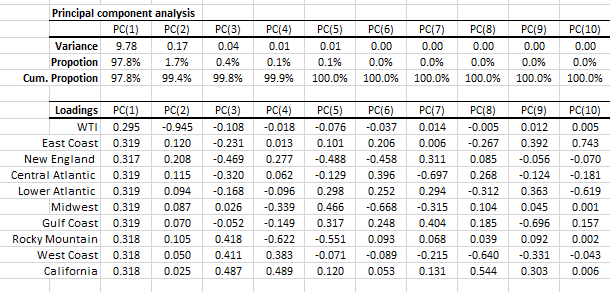
As a last thought on the WTI spot price, we will include the WTI spot price in our input data set and re-examine the input loadings. Intuitively, adding an input variable for raw material price (i.e. crude oil) with the finished products prices in the same data set will likely reveal another driver: cost of production.
Now, we’d need three drivers to account for 99.8% of the price variation.
IMPORTANT: The principal components of the new data set are not necessarily the same as the ones we computed earlier with only the diesel prices.
Let’s look at the input variable’s loadings in each principal component (i.e. driver):
Notes:
- The loadings for the first component are similar to ones we calculated earlier with only the diesel prices. Note that the WTI loadings are slightly lower than their diesel counterparts. Again, we’ll designate this factor as the general price level (region neutral).
- The loadings for the second factor are very different now, and the loading for WTI is negative (-%94.5) while all the rest are positive. We can designate this factor as the cost of cracking diesel of crude.
- The loading for the 3rd factor is very similar to the loading of the second component in the earlier data sets. Again, the loading varies based on the location (east vs. west). The WTI, Gulf Coast, and Midwest are almost neutral.
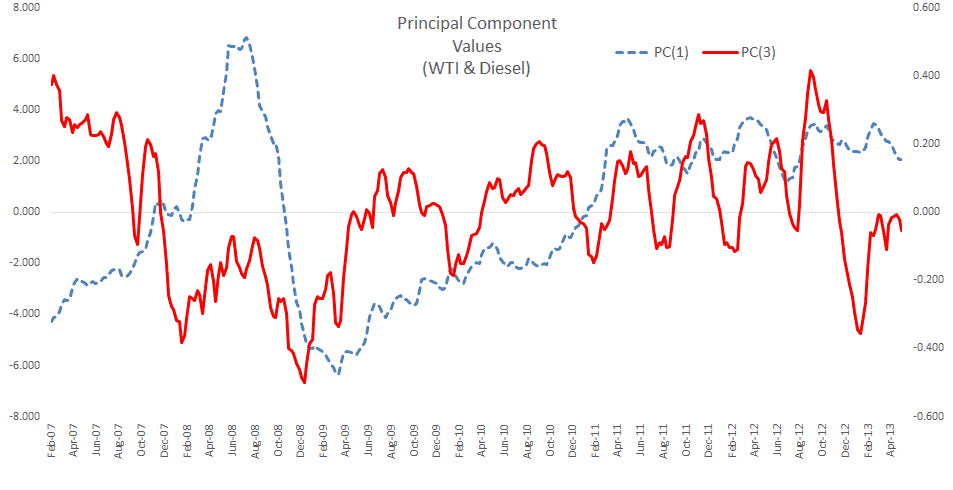
Let’s now plot the factor’s time series.
In general terms, the first and the third component are very similar to the first two components we calculated earlier (w/o WTI in the data set).
For the second component, we hypothesize this one as the proxy of the diesel cracking cost.
Conclusion
In this study, we examined a non-trivial application for PCA. We attempted to explain the price variation among different PADD regions by uncovering the driving forces behind the prices.
What's next?
We mentioned earlier that refineries build up inventory of products (e.g. diesel) in anticipation of the seasonal demand peaks, so there may be a lag. How do we capture this variable? Futures: we can include the future prices of the diesel and crude oil.
Why?
Intuitively, futures prices reflect market anticipation of (1) future demand (2) future storage cost, and possibly a premium for supply scarcity. This application is intended to give you a sample of how to apply PCA and time series, as well as how to use or interpret the variables’ loadings in deriving a practical proxy for them.
In sum, PCA is a mathematical procedure that NumXL can help you execute. Making sense of and interpreting the results is where your expertise and intuition are indispensable.

